Nepalese vs Tongan Divorced or Separated
COMPARE
Nepalese
Tongan
Divorced or Separated
Divorced or Separated Comparison
Nepalese
Tongans
12.5%
DIVORCED OR SEPARATED
1.8/ 100
METRIC RATING
248th/ 347
METRIC RANK
11.1%
DIVORCED OR SEPARATED
100.0/ 100
METRIC RATING
32nd/ 347
METRIC RANK
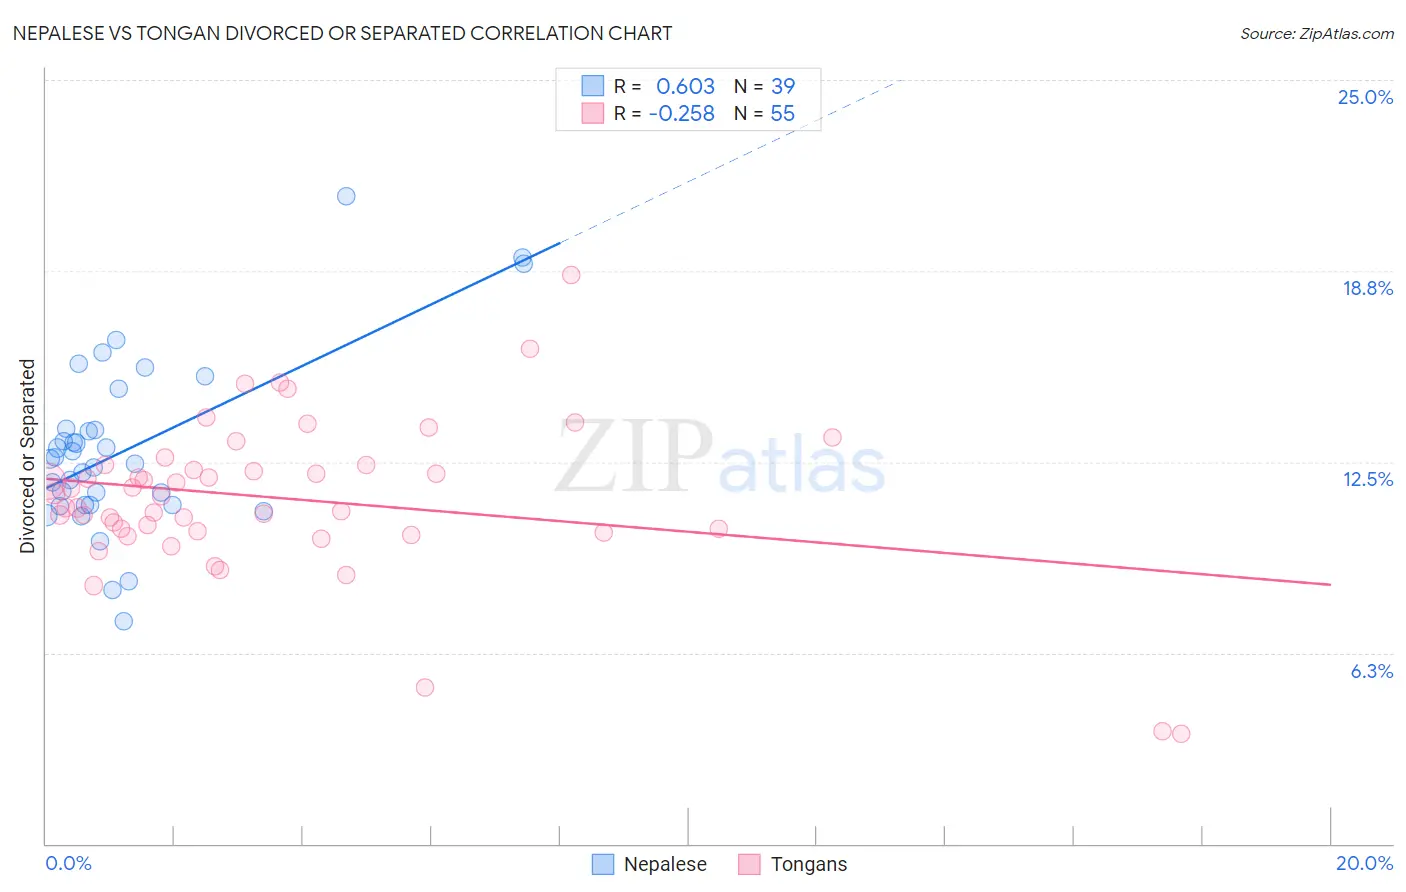
Nepalese vs Tongan Divorced or Separated Correlation Chart
The statistical analysis conducted on geographies consisting of 24,519,269 people shows a significant positive correlation between the proportion of Nepalese and percentage of population currently divorced or separated in the United States with a correlation coefficient (R) of 0.603 and weighted average of 12.5%. Similarly, the statistical analysis conducted on geographies consisting of 102,897,047 people shows a weak negative correlation between the proportion of Tongans and percentage of population currently divorced or separated in the United States with a correlation coefficient (R) of -0.258 and weighted average of 11.1%, a difference of 12.6%.
Divorced or Separated Correlation Summary
| Measurement | Nepalese | Tongan |
| Minimum | 7.3% | 3.6% |
| Maximum | 21.2% | 18.6% |
| Range | 13.9% | 15.0% |
| Mean | 12.9% | 11.3% |
| Median | 12.6% | 11.4% |
| Interquartile 25% (IQ1) | 11.1% | 10.2% |
| Interquartile 75% (IQ3) | 13.6% | 12.4% |
| Interquartile Range (IQR) | 2.5% | 2.1% |
| Standard Deviation (Sample) | 2.9% | 2.6% |
| Standard Deviation (Population) | 2.8% | 2.6% |
Similar Demographics by Divorced or Separated
Demographics Similar to Nepalese by Divorced or Separated
In terms of divorced or separated, the demographic groups most similar to Nepalese are Finnish (12.5%, a difference of 0.010%), German (12.5%, a difference of 0.020%), Immigrants from West Indies (12.5%, a difference of 0.060%), Hispanic or Latino (12.5%, a difference of 0.080%), and Irish (12.5%, a difference of 0.29%).
| Demographics | Rating | Rank | Divorced or Separated |
| Uruguayans | 3.4 /100 | #241 | Tragic 12.4% |
| Dutch | 3.1 /100 | #242 | Tragic 12.4% |
| Immigrants | Latin America | 2.8 /100 | #243 | Tragic 12.4% |
| Alaska Natives | 2.5 /100 | #244 | Tragic 12.4% |
| Hispanics or Latinos | 2.0 /100 | #245 | Tragic 12.5% |
| Immigrants | West Indies | 1.9 /100 | #246 | Tragic 12.5% |
| Germans | 1.8 /100 | #247 | Tragic 12.5% |
| Nepalese | 1.8 /100 | #248 | Tragic 12.5% |
| Finns | 1.8 /100 | #249 | Tragic 12.5% |
| Irish | 1.3 /100 | #250 | Tragic 12.5% |
| Aleuts | 1.3 /100 | #251 | Tragic 12.5% |
| Liberians | 0.9 /100 | #252 | Tragic 12.6% |
| Somalis | 0.9 /100 | #253 | Tragic 12.6% |
| Senegalese | 0.8 /100 | #254 | Tragic 12.6% |
| Welsh | 0.7 /100 | #255 | Tragic 12.6% |
Demographics Similar to Tongans by Divorced or Separated
In terms of divorced or separated, the demographic groups most similar to Tongans are Egyptian (11.1%, a difference of 0.040%), Mongolian (11.1%, a difference of 0.080%), Immigrants from Uzbekistan (11.1%, a difference of 0.12%), Cambodian (11.1%, a difference of 0.20%), and Immigrants from Japan (11.1%, a difference of 0.25%).
| Demographics | Rating | Rank | Divorced or Separated |
| Iranians | 100.0 /100 | #25 | Exceptional 10.8% |
| Immigrants | Indonesia | 100.0 /100 | #26 | Exceptional 10.9% |
| Immigrants | Bangladesh | 100.0 /100 | #27 | Exceptional 11.0% |
| Immigrants | Malaysia | 100.0 /100 | #28 | Exceptional 11.0% |
| Armenians | 100.0 /100 | #29 | Exceptional 11.0% |
| Immigrants | Ireland | 100.0 /100 | #30 | Exceptional 11.0% |
| Mongolians | 100.0 /100 | #31 | Exceptional 11.1% |
| Tongans | 100.0 /100 | #32 | Exceptional 11.1% |
| Egyptians | 100.0 /100 | #33 | Exceptional 11.1% |
| Immigrants | Uzbekistan | 100.0 /100 | #34 | Exceptional 11.1% |
| Cambodians | 100.0 /100 | #35 | Exceptional 11.1% |
| Immigrants | Japan | 100.0 /100 | #36 | Exceptional 11.1% |
| Immigrants | Lebanon | 100.0 /100 | #37 | Exceptional 11.1% |
| Immigrants | Greece | 100.0 /100 | #38 | Exceptional 11.1% |
| Immigrants | Egypt | 100.0 /100 | #39 | Exceptional 11.1% |