Nepalese vs Immigrants from South America Divorced or Separated
COMPARE
Nepalese
Immigrants from South America
Divorced or Separated
Divorced or Separated Comparison
Nepalese
Immigrants from South America
12.5%
DIVORCED OR SEPARATED
1.8/ 100
METRIC RATING
248th/ 347
METRIC RANK
12.2%
DIVORCED OR SEPARATED
15.4/ 100
METRIC RATING
216th/ 347
METRIC RANK
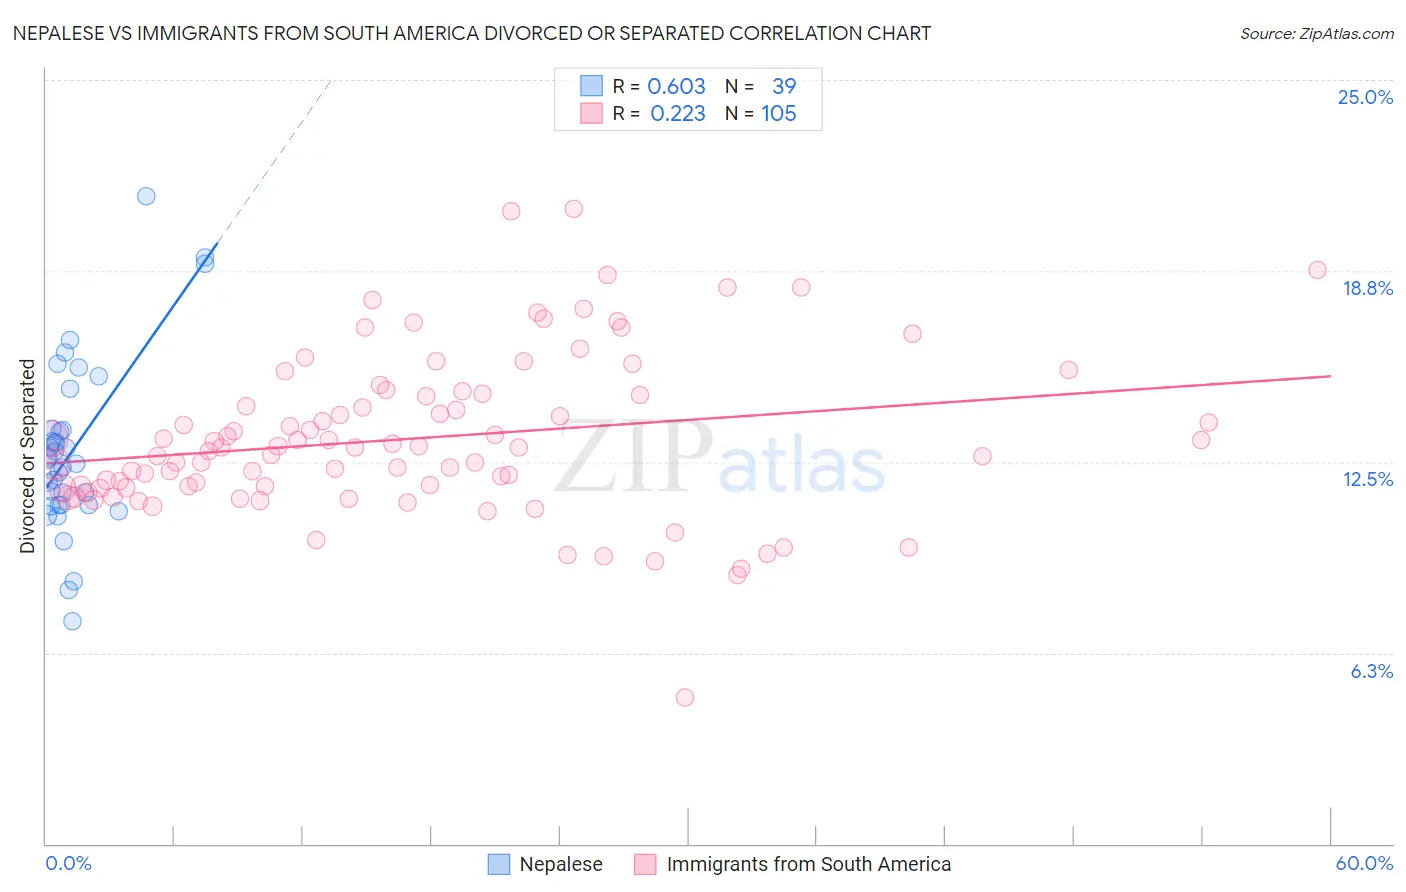
Nepalese vs Immigrants from South America Divorced or Separated Correlation Chart
The statistical analysis conducted on geographies consisting of 24,519,269 people shows a significant positive correlation between the proportion of Nepalese and percentage of population currently divorced or separated in the United States with a correlation coefficient (R) of 0.603 and weighted average of 12.5%. Similarly, the statistical analysis conducted on geographies consisting of 486,185,225 people shows a weak positive correlation between the proportion of Immigrants from South America and percentage of population currently divorced or separated in the United States with a correlation coefficient (R) of 0.223 and weighted average of 12.2%, a difference of 2.0%.
Divorced or Separated Correlation Summary
| Measurement | Nepalese | Immigrants from South America |
| Minimum | 7.3% | 4.8% |
| Maximum | 21.2% | 20.8% |
| Range | 13.9% | 16.0% |
| Mean | 12.9% | 13.3% |
| Median | 12.6% | 13.0% |
| Interquartile 25% (IQ1) | 11.1% | 11.6% |
| Interquartile 75% (IQ3) | 13.6% | 14.7% |
| Interquartile Range (IQR) | 2.5% | 3.1% |
| Standard Deviation (Sample) | 2.9% | 2.6% |
| Standard Deviation (Population) | 2.8% | 2.6% |
Similar Demographics by Divorced or Separated
Demographics Similar to Nepalese by Divorced or Separated
In terms of divorced or separated, the demographic groups most similar to Nepalese are Finnish (12.5%, a difference of 0.010%), German (12.5%, a difference of 0.020%), Immigrants from West Indies (12.5%, a difference of 0.060%), Hispanic or Latino (12.5%, a difference of 0.080%), and Irish (12.5%, a difference of 0.29%).
| Demographics | Rating | Rank | Divorced or Separated |
| Uruguayans | 3.4 /100 | #241 | Tragic 12.4% |
| Dutch | 3.1 /100 | #242 | Tragic 12.4% |
| Immigrants | Latin America | 2.8 /100 | #243 | Tragic 12.4% |
| Alaska Natives | 2.5 /100 | #244 | Tragic 12.4% |
| Hispanics or Latinos | 2.0 /100 | #245 | Tragic 12.5% |
| Immigrants | West Indies | 1.9 /100 | #246 | Tragic 12.5% |
| Germans | 1.8 /100 | #247 | Tragic 12.5% |
| Nepalese | 1.8 /100 | #248 | Tragic 12.5% |
| Finns | 1.8 /100 | #249 | Tragic 12.5% |
| Irish | 1.3 /100 | #250 | Tragic 12.5% |
| Aleuts | 1.3 /100 | #251 | Tragic 12.5% |
| Liberians | 0.9 /100 | #252 | Tragic 12.6% |
| Somalis | 0.9 /100 | #253 | Tragic 12.6% |
| Senegalese | 0.8 /100 | #254 | Tragic 12.6% |
| Welsh | 0.7 /100 | #255 | Tragic 12.6% |
Demographics Similar to Immigrants from South America by Divorced or Separated
In terms of divorced or separated, the demographic groups most similar to Immigrants from South America are European (12.2%, a difference of 0.0%), Immigrants from Argentina (12.2%, a difference of 0.010%), Northern European (12.2%, a difference of 0.040%), Immigrants from Eastern Africa (12.2%, a difference of 0.050%), and Immigrants from Kenya (12.2%, a difference of 0.070%).
| Demographics | Rating | Rank | Divorced or Separated |
| Immigrants | Trinidad and Tobago | 17.8 /100 | #209 | Poor 12.2% |
| Slavs | 17.0 /100 | #210 | Poor 12.2% |
| Trinidadians and Tobagonians | 16.6 /100 | #211 | Poor 12.2% |
| Immigrants | Kenya | 16.5 /100 | #212 | Poor 12.2% |
| Immigrants | Eastern Africa | 16.2 /100 | #213 | Poor 12.2% |
| Immigrants | Argentina | 15.5 /100 | #214 | Poor 12.2% |
| Europeans | 15.4 /100 | #215 | Poor 12.2% |
| Immigrants | South America | 15.4 /100 | #216 | Poor 12.2% |
| Northern Europeans | 14.7 /100 | #217 | Poor 12.2% |
| Slovenes | 13.2 /100 | #218 | Poor 12.3% |
| Czechoslovakians | 11.7 /100 | #219 | Poor 12.3% |
| British | 11.6 /100 | #220 | Poor 12.3% |
| Guamanians/Chamorros | 11.3 /100 | #221 | Poor 12.3% |
| Bangladeshis | 10.5 /100 | #222 | Poor 12.3% |
| Scandinavians | 10.4 /100 | #223 | Poor 12.3% |