Cajun vs New Zealander Divorced or Separated
COMPARE
Cajun
New Zealander
Divorced or Separated
Divorced or Separated Comparison
Cajuns
New Zealanders
13.4%
DIVORCED OR SEPARATED
0.0/ 100
METRIC RATING
320th/ 347
METRIC RANK
11.9%
DIVORCED OR SEPARATED
87.5/ 100
METRIC RATING
133rd/ 347
METRIC RANK
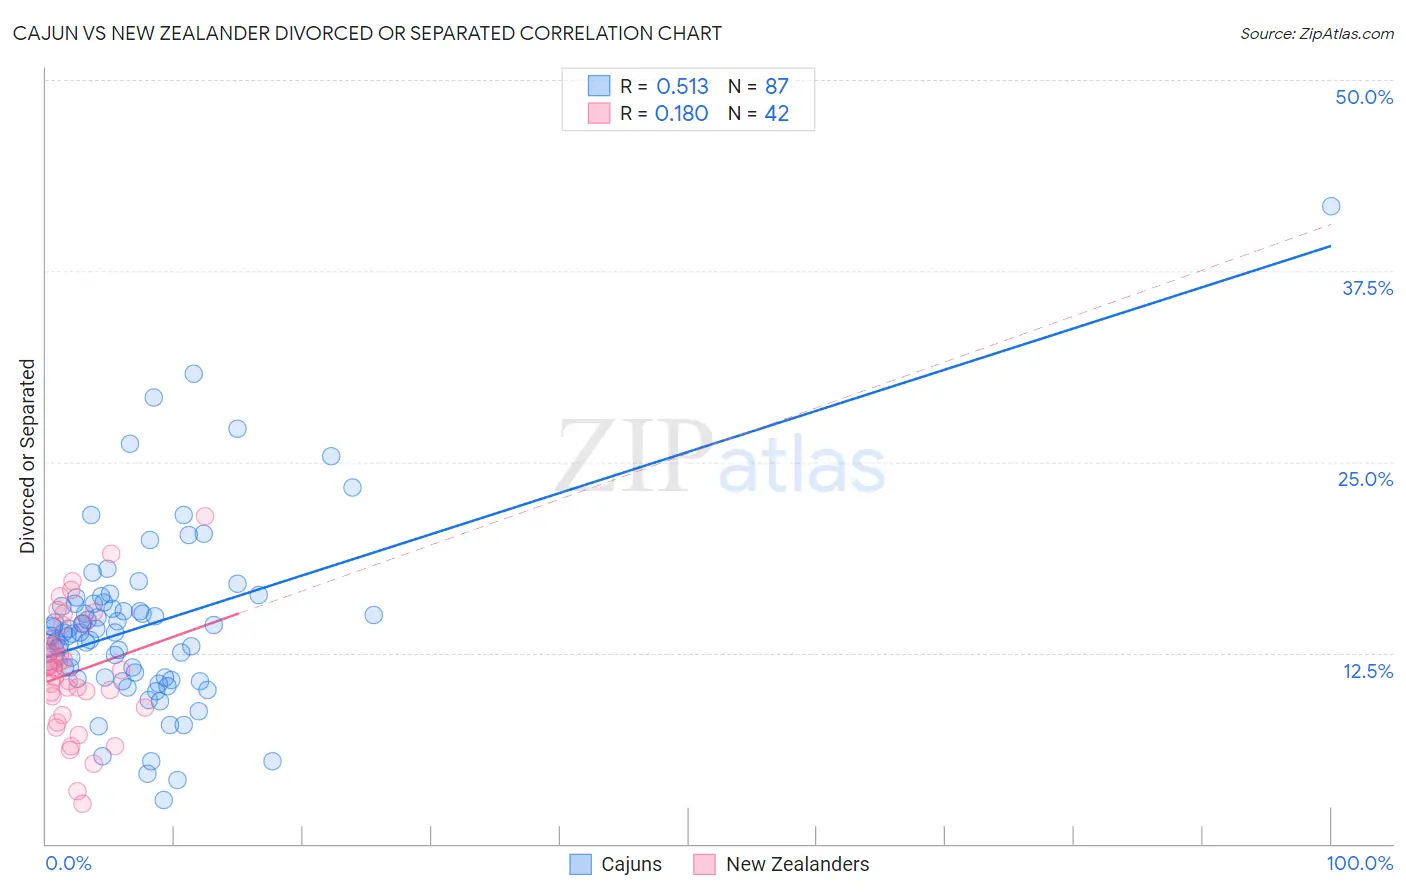
Cajun vs New Zealander Divorced or Separated Correlation Chart
The statistical analysis conducted on geographies consisting of 149,704,067 people shows a substantial positive correlation between the proportion of Cajuns and percentage of population currently divorced or separated in the United States with a correlation coefficient (R) of 0.513 and weighted average of 13.4%. Similarly, the statistical analysis conducted on geographies consisting of 106,899,589 people shows a poor positive correlation between the proportion of New Zealanders and percentage of population currently divorced or separated in the United States with a correlation coefficient (R) of 0.180 and weighted average of 11.9%, a difference of 12.8%.
Divorced or Separated Correlation Summary
| Measurement | Cajun | New Zealander |
| Minimum | 2.9% | 2.6% |
| Maximum | 41.7% | 21.4% |
| Range | 38.8% | 18.8% |
| Mean | 14.3% | 11.2% |
| Median | 13.8% | 11.4% |
| Interquartile 25% (IQ1) | 10.9% | 8.9% |
| Interquartile 75% (IQ3) | 15.7% | 13.4% |
| Interquartile Range (IQR) | 4.9% | 4.5% |
| Standard Deviation (Sample) | 5.9% | 4.0% |
| Standard Deviation (Population) | 5.9% | 3.9% |
Similar Demographics by Divorced or Separated
Demographics Similar to Cajuns by Divorced or Separated
In terms of divorced or separated, the demographic groups most similar to Cajuns are Puget Sound Salish (13.4%, a difference of 0.060%), Cree (13.4%, a difference of 0.10%), Cheyenne (13.4%, a difference of 0.10%), Haitian (13.3%, a difference of 0.12%), and Tsimshian (13.3%, a difference of 0.14%).
| Demographics | Rating | Rank | Divorced or Separated |
| Immigrants | Nicaragua | 0.0 /100 | #313 | Tragic 13.3% |
| Yaqui | 0.0 /100 | #314 | Tragic 13.3% |
| Spanish Americans | 0.0 /100 | #315 | Tragic 13.3% |
| Tsimshian | 0.0 /100 | #316 | Tragic 13.3% |
| Haitians | 0.0 /100 | #317 | Tragic 13.3% |
| Cree | 0.0 /100 | #318 | Tragic 13.4% |
| Puget Sound Salish | 0.0 /100 | #319 | Tragic 13.4% |
| Cajuns | 0.0 /100 | #320 | Tragic 13.4% |
| Cheyenne | 0.0 /100 | #321 | Tragic 13.4% |
| Immigrants | Haiti | 0.0 /100 | #322 | Tragic 13.4% |
| U.S. Virgin Islanders | 0.0 /100 | #323 | Tragic 13.4% |
| Osage | 0.0 /100 | #324 | Tragic 13.4% |
| Potawatomi | 0.0 /100 | #325 | Tragic 13.5% |
| Immigrants | Congo | 0.0 /100 | #326 | Tragic 13.5% |
| Comanche | 0.0 /100 | #327 | Tragic 13.5% |
Demographics Similar to New Zealanders by Divorced or Separated
In terms of divorced or separated, the demographic groups most similar to New Zealanders are Immigrants from Afghanistan (11.8%, a difference of 0.030%), Immigrants from Austria (11.8%, a difference of 0.060%), Immigrants from Cambodia (11.8%, a difference of 0.060%), Immigrants from St. Vincent and the Grenadines (11.8%, a difference of 0.070%), and Immigrants from Ecuador (11.8%, a difference of 0.11%).
| Demographics | Rating | Rank | Divorced or Separated |
| South American Indians | 92.1 /100 | #126 | Exceptional 11.8% |
| South Africans | 88.9 /100 | #127 | Excellent 11.8% |
| Immigrants | Ecuador | 88.9 /100 | #128 | Excellent 11.8% |
| Immigrants | St. Vincent and the Grenadines | 88.4 /100 | #129 | Excellent 11.8% |
| Immigrants | Austria | 88.2 /100 | #130 | Excellent 11.8% |
| Immigrants | Cambodia | 88.2 /100 | #131 | Excellent 11.8% |
| Immigrants | Afghanistan | 87.9 /100 | #132 | Excellent 11.8% |
| New Zealanders | 87.5 /100 | #133 | Excellent 11.9% |
| Argentineans | 85.1 /100 | #134 | Excellent 11.9% |
| Danes | 84.8 /100 | #135 | Excellent 11.9% |
| Carpatho Rusyns | 84.8 /100 | #136 | Excellent 11.9% |
| Alsatians | 84.0 /100 | #137 | Excellent 11.9% |
| Immigrants | Netherlands | 83.9 /100 | #138 | Excellent 11.9% |
| Australians | 83.6 /100 | #139 | Excellent 11.9% |
| Lebanese | 83.4 /100 | #140 | Excellent 11.9% |