Mexican vs New Zealander Divorced or Separated
COMPARE
Mexican
New Zealander
Divorced or Separated
Divorced or Separated Comparison
Mexicans
New Zealanders
12.2%
DIVORCED OR SEPARATED
21.0/ 100
METRIC RATING
207th/ 347
METRIC RANK
11.9%
DIVORCED OR SEPARATED
87.5/ 100
METRIC RATING
133rd/ 347
METRIC RANK
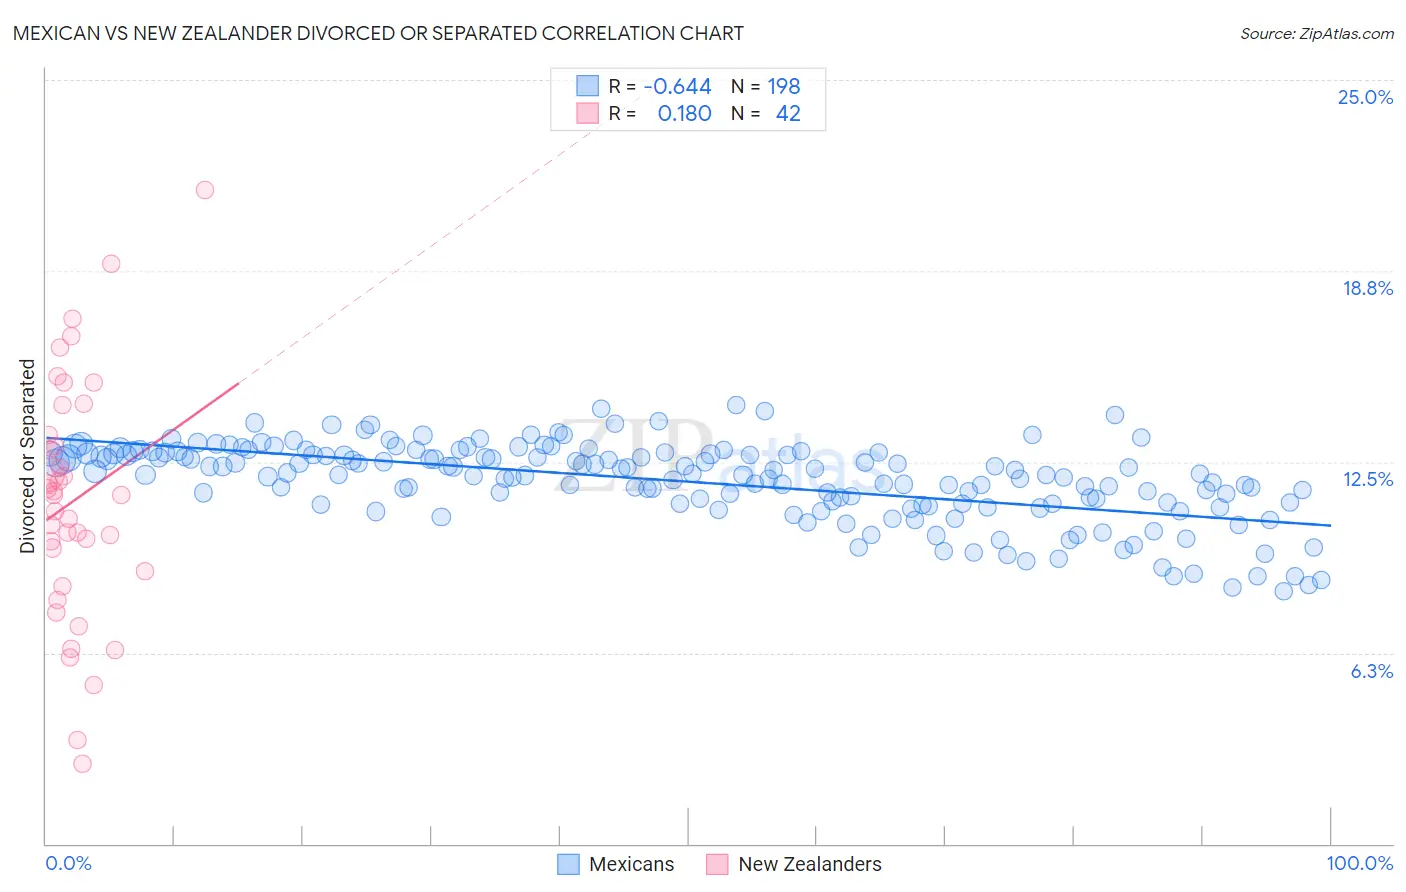
Mexican vs New Zealander Divorced or Separated Correlation Chart
The statistical analysis conducted on geographies consisting of 564,740,181 people shows a significant negative correlation between the proportion of Mexicans and percentage of population currently divorced or separated in the United States with a correlation coefficient (R) of -0.644 and weighted average of 12.2%. Similarly, the statistical analysis conducted on geographies consisting of 106,899,589 people shows a poor positive correlation between the proportion of New Zealanders and percentage of population currently divorced or separated in the United States with a correlation coefficient (R) of 0.180 and weighted average of 11.9%, a difference of 2.9%.
Divorced or Separated Correlation Summary
| Measurement | Mexican | New Zealander |
| Minimum | 8.3% | 2.6% |
| Maximum | 14.3% | 21.4% |
| Range | 6.1% | 18.8% |
| Mean | 11.9% | 11.2% |
| Median | 12.1% | 11.4% |
| Interquartile 25% (IQ1) | 11.1% | 8.9% |
| Interquartile 75% (IQ3) | 12.8% | 13.4% |
| Interquartile Range (IQR) | 1.6% | 4.5% |
| Standard Deviation (Sample) | 1.3% | 4.0% |
| Standard Deviation (Population) | 1.3% | 3.9% |
Similar Demographics by Divorced or Separated
Demographics Similar to Mexicans by Divorced or Separated
In terms of divorced or separated, the demographic groups most similar to Mexicans are Slovak (12.2%, a difference of 0.0%), Immigrants from Costa Rica (12.2%, a difference of 0.010%), Kenyan (12.2%, a difference of 0.040%), Immigrants from Guatemala (12.2%, a difference of 0.11%), and Immigrants from Ghana (12.2%, a difference of 0.12%).
| Demographics | Rating | Rank | Divorced or Separated |
| South Americans | 28.6 /100 | #200 | Fair 12.2% |
| Guatemalans | 26.9 /100 | #201 | Fair 12.2% |
| Portuguese | 23.5 /100 | #202 | Fair 12.2% |
| Immigrants | Guatemala | 23.2 /100 | #203 | Fair 12.2% |
| Kenyans | 21.8 /100 | #204 | Fair 12.2% |
| Immigrants | Costa Rica | 21.3 /100 | #205 | Fair 12.2% |
| Slovaks | 21.0 /100 | #206 | Fair 12.2% |
| Mexicans | 21.0 /100 | #207 | Fair 12.2% |
| Immigrants | Ghana | 18.8 /100 | #208 | Poor 12.2% |
| Immigrants | Trinidad and Tobago | 17.8 /100 | #209 | Poor 12.2% |
| Slavs | 17.0 /100 | #210 | Poor 12.2% |
| Trinidadians and Tobagonians | 16.6 /100 | #211 | Poor 12.2% |
| Immigrants | Kenya | 16.5 /100 | #212 | Poor 12.2% |
| Immigrants | Eastern Africa | 16.2 /100 | #213 | Poor 12.2% |
| Immigrants | Argentina | 15.5 /100 | #214 | Poor 12.2% |
Demographics Similar to New Zealanders by Divorced or Separated
In terms of divorced or separated, the demographic groups most similar to New Zealanders are Immigrants from Afghanistan (11.8%, a difference of 0.030%), Immigrants from Austria (11.8%, a difference of 0.060%), Immigrants from Cambodia (11.8%, a difference of 0.060%), Immigrants from St. Vincent and the Grenadines (11.8%, a difference of 0.070%), and Immigrants from Ecuador (11.8%, a difference of 0.11%).
| Demographics | Rating | Rank | Divorced or Separated |
| South American Indians | 92.1 /100 | #126 | Exceptional 11.8% |
| South Africans | 88.9 /100 | #127 | Excellent 11.8% |
| Immigrants | Ecuador | 88.9 /100 | #128 | Excellent 11.8% |
| Immigrants | St. Vincent and the Grenadines | 88.4 /100 | #129 | Excellent 11.8% |
| Immigrants | Austria | 88.2 /100 | #130 | Excellent 11.8% |
| Immigrants | Cambodia | 88.2 /100 | #131 | Excellent 11.8% |
| Immigrants | Afghanistan | 87.9 /100 | #132 | Excellent 11.8% |
| New Zealanders | 87.5 /100 | #133 | Excellent 11.9% |
| Argentineans | 85.1 /100 | #134 | Excellent 11.9% |
| Danes | 84.8 /100 | #135 | Excellent 11.9% |
| Carpatho Rusyns | 84.8 /100 | #136 | Excellent 11.9% |
| Alsatians | 84.0 /100 | #137 | Excellent 11.9% |
| Immigrants | Netherlands | 83.9 /100 | #138 | Excellent 11.9% |
| Australians | 83.6 /100 | #139 | Excellent 11.9% |
| Lebanese | 83.4 /100 | #140 | Excellent 11.9% |