Nepalese vs Czech Divorced or Separated
COMPARE
Nepalese
Czech
Divorced or Separated
Divorced or Separated Comparison
Nepalese
Czechs
12.5%
DIVORCED OR SEPARATED
1.8/ 100
METRIC RATING
248th/ 347
METRIC RANK
11.9%
DIVORCED OR SEPARATED
76.4/ 100
METRIC RATING
151st/ 347
METRIC RANK
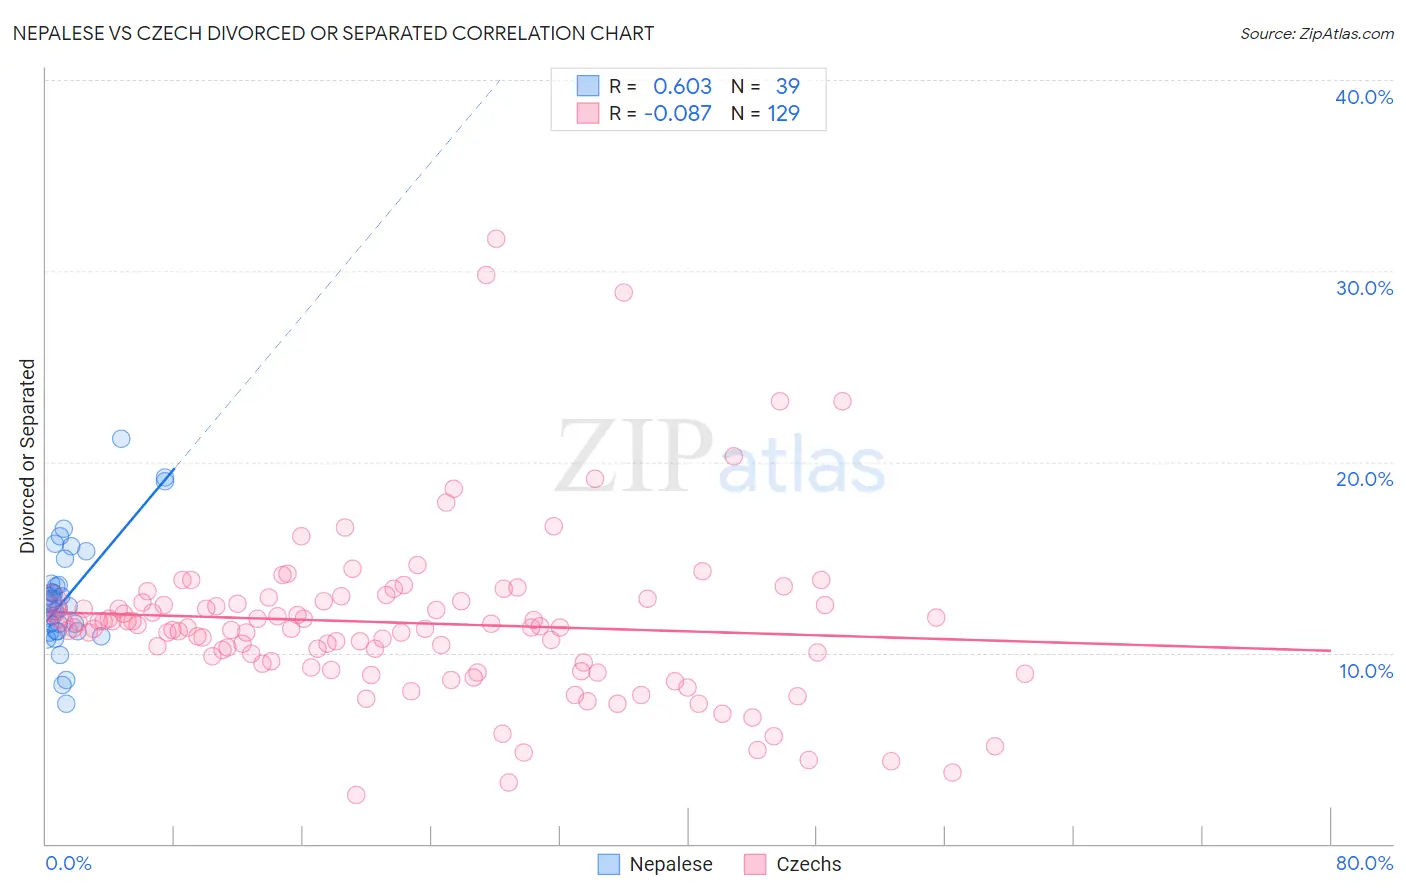
Nepalese vs Czech Divorced or Separated Correlation Chart
The statistical analysis conducted on geographies consisting of 24,519,269 people shows a significant positive correlation between the proportion of Nepalese and percentage of population currently divorced or separated in the United States with a correlation coefficient (R) of 0.603 and weighted average of 12.5%. Similarly, the statistical analysis conducted on geographies consisting of 484,565,083 people shows a slight negative correlation between the proportion of Czechs and percentage of population currently divorced or separated in the United States with a correlation coefficient (R) of -0.087 and weighted average of 11.9%, a difference of 4.5%.
Divorced or Separated Correlation Summary
| Measurement | Nepalese | Czech |
| Minimum | 7.3% | 2.5% |
| Maximum | 21.2% | 31.7% |
| Range | 13.9% | 29.2% |
| Mean | 12.9% | 11.6% |
| Median | 12.6% | 11.3% |
| Interquartile 25% (IQ1) | 11.1% | 9.5% |
| Interquartile 75% (IQ3) | 13.6% | 12.7% |
| Interquartile Range (IQR) | 2.5% | 3.2% |
| Standard Deviation (Sample) | 2.9% | 4.4% |
| Standard Deviation (Population) | 2.8% | 4.4% |
Similar Demographics by Divorced or Separated
Demographics Similar to Nepalese by Divorced or Separated
In terms of divorced or separated, the demographic groups most similar to Nepalese are Finnish (12.5%, a difference of 0.010%), German (12.5%, a difference of 0.020%), Immigrants from West Indies (12.5%, a difference of 0.060%), Hispanic or Latino (12.5%, a difference of 0.080%), and Irish (12.5%, a difference of 0.29%).
| Demographics | Rating | Rank | Divorced or Separated |
| Uruguayans | 3.4 /100 | #241 | Tragic 12.4% |
| Dutch | 3.1 /100 | #242 | Tragic 12.4% |
| Immigrants | Latin America | 2.8 /100 | #243 | Tragic 12.4% |
| Alaska Natives | 2.5 /100 | #244 | Tragic 12.4% |
| Hispanics or Latinos | 2.0 /100 | #245 | Tragic 12.5% |
| Immigrants | West Indies | 1.9 /100 | #246 | Tragic 12.5% |
| Germans | 1.8 /100 | #247 | Tragic 12.5% |
| Nepalese | 1.8 /100 | #248 | Tragic 12.5% |
| Finns | 1.8 /100 | #249 | Tragic 12.5% |
| Irish | 1.3 /100 | #250 | Tragic 12.5% |
| Aleuts | 1.3 /100 | #251 | Tragic 12.5% |
| Liberians | 0.9 /100 | #252 | Tragic 12.6% |
| Somalis | 0.9 /100 | #253 | Tragic 12.6% |
| Senegalese | 0.8 /100 | #254 | Tragic 12.6% |
| Welsh | 0.7 /100 | #255 | Tragic 12.6% |
Demographics Similar to Czechs by Divorced or Separated
In terms of divorced or separated, the demographic groups most similar to Czechs are Immigrants from Portugal (11.9%, a difference of 0.040%), Immigrants from Oceania (11.9%, a difference of 0.060%), Italian (11.9%, a difference of 0.070%), Polish (11.9%, a difference of 0.11%), and Immigrants from Hungary (11.9%, a difference of 0.13%).
| Demographics | Rating | Rank | Divorced or Separated |
| Peruvians | 80.9 /100 | #144 | Excellent 11.9% |
| Croatians | 80.6 /100 | #145 | Excellent 11.9% |
| Immigrants | Grenada | 79.1 /100 | #146 | Good 11.9% |
| Poles | 78.6 /100 | #147 | Good 11.9% |
| Italians | 77.8 /100 | #148 | Good 11.9% |
| Immigrants | Oceania | 77.7 /100 | #149 | Good 11.9% |
| Immigrants | Portugal | 77.3 /100 | #150 | Good 11.9% |
| Czechs | 76.4 /100 | #151 | Good 11.9% |
| Immigrants | Hungary | 73.7 /100 | #152 | Good 11.9% |
| Austrians | 72.2 /100 | #153 | Good 12.0% |
| Chileans | 71.3 /100 | #154 | Good 12.0% |
| Japanese | 70.9 /100 | #155 | Good 12.0% |
| Hungarians | 70.3 /100 | #156 | Good 12.0% |
| Immigrants | Brazil | 68.8 /100 | #157 | Good 12.0% |
| Icelanders | 66.0 /100 | #158 | Good 12.0% |