Nepalese vs Samoan Divorced or Separated
COMPARE
Nepalese
Samoan
Divorced or Separated
Divorced or Separated Comparison
Nepalese
Samoans
12.5%
DIVORCED OR SEPARATED
1.8/ 100
METRIC RATING
248th/ 347
METRIC RANK
12.0%
DIVORCED OR SEPARATED
64.3/ 100
METRIC RATING
162nd/ 347
METRIC RANK
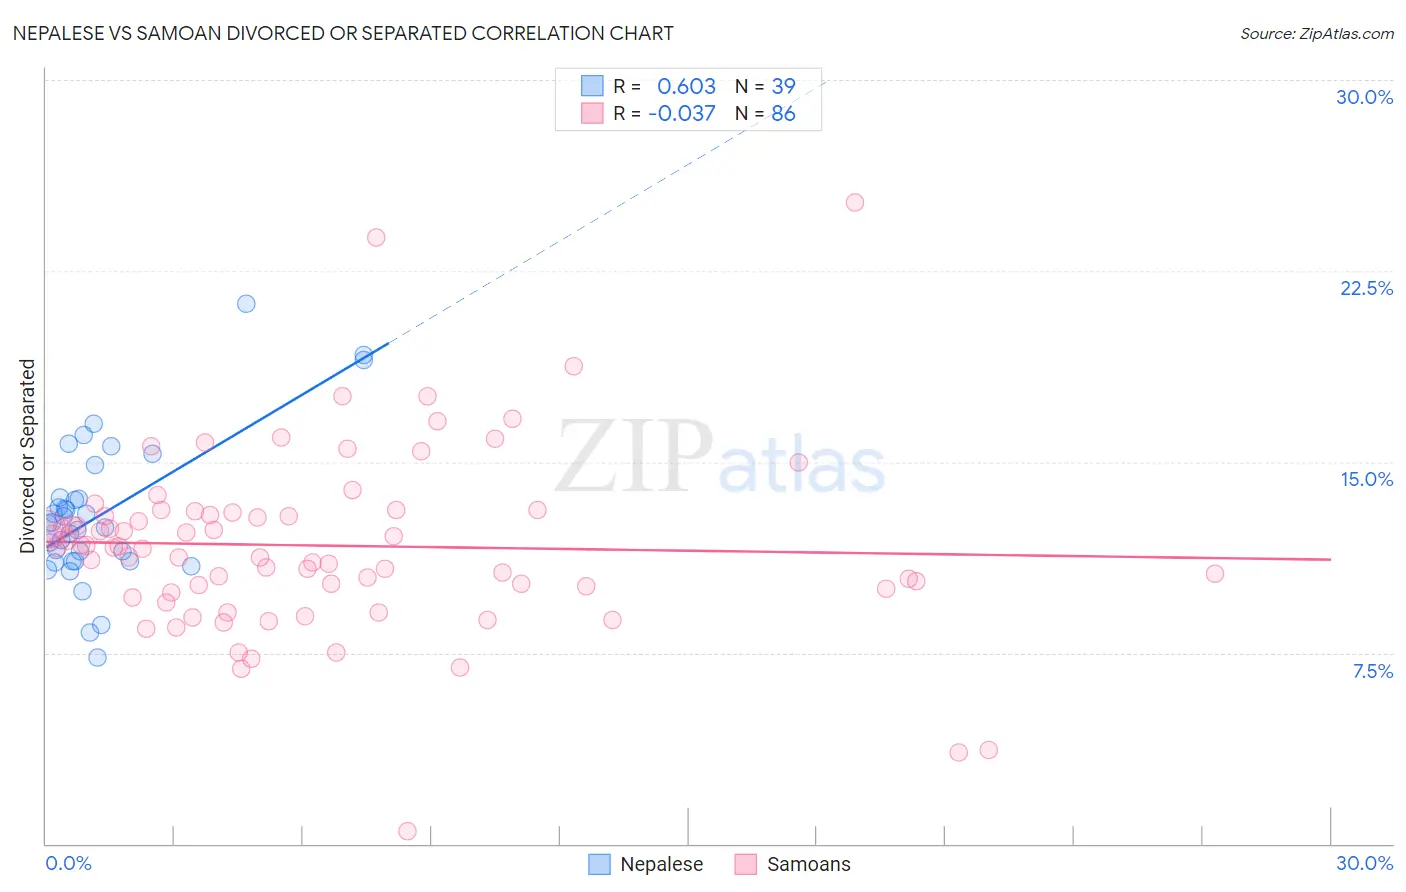
Nepalese vs Samoan Divorced or Separated Correlation Chart
The statistical analysis conducted on geographies consisting of 24,519,269 people shows a significant positive correlation between the proportion of Nepalese and percentage of population currently divorced or separated in the United States with a correlation coefficient (R) of 0.603 and weighted average of 12.5%. Similarly, the statistical analysis conducted on geographies consisting of 225,171,159 people shows no correlation between the proportion of Samoans and percentage of population currently divorced or separated in the United States with a correlation coefficient (R) of -0.037 and weighted average of 12.0%, a difference of 4.0%.
Divorced or Separated Correlation Summary
| Measurement | Nepalese | Samoan |
| Minimum | 7.3% | 0.50% |
| Maximum | 21.2% | 25.2% |
| Range | 13.9% | 24.7% |
| Mean | 12.9% | 11.7% |
| Median | 12.6% | 11.7% |
| Interquartile 25% (IQ1) | 11.1% | 10.0% |
| Interquartile 75% (IQ3) | 13.6% | 13.0% |
| Interquartile Range (IQR) | 2.5% | 3.0% |
| Standard Deviation (Sample) | 2.9% | 3.6% |
| Standard Deviation (Population) | 2.8% | 3.6% |
Similar Demographics by Divorced or Separated
Demographics Similar to Nepalese by Divorced or Separated
In terms of divorced or separated, the demographic groups most similar to Nepalese are Finnish (12.5%, a difference of 0.010%), German (12.5%, a difference of 0.020%), Immigrants from West Indies (12.5%, a difference of 0.060%), Hispanic or Latino (12.5%, a difference of 0.080%), and Irish (12.5%, a difference of 0.29%).
| Demographics | Rating | Rank | Divorced or Separated |
| Uruguayans | 3.4 /100 | #241 | Tragic 12.4% |
| Dutch | 3.1 /100 | #242 | Tragic 12.4% |
| Immigrants | Latin America | 2.8 /100 | #243 | Tragic 12.4% |
| Alaska Natives | 2.5 /100 | #244 | Tragic 12.4% |
| Hispanics or Latinos | 2.0 /100 | #245 | Tragic 12.5% |
| Immigrants | West Indies | 1.9 /100 | #246 | Tragic 12.5% |
| Germans | 1.8 /100 | #247 | Tragic 12.5% |
| Nepalese | 1.8 /100 | #248 | Tragic 12.5% |
| Finns | 1.8 /100 | #249 | Tragic 12.5% |
| Irish | 1.3 /100 | #250 | Tragic 12.5% |
| Aleuts | 1.3 /100 | #251 | Tragic 12.5% |
| Liberians | 0.9 /100 | #252 | Tragic 12.6% |
| Somalis | 0.9 /100 | #253 | Tragic 12.6% |
| Senegalese | 0.8 /100 | #254 | Tragic 12.6% |
| Welsh | 0.7 /100 | #255 | Tragic 12.6% |
Demographics Similar to Samoans by Divorced or Separated
In terms of divorced or separated, the demographic groups most similar to Samoans are Marshallese (12.0%, a difference of 0.010%), Navajo (12.0%, a difference of 0.010%), Swiss (12.0%, a difference of 0.020%), Immigrants from Scotland (12.0%, a difference of 0.060%), and Icelander (12.0%, a difference of 0.070%).
| Demographics | Rating | Rank | Divorced or Separated |
| Japanese | 70.9 /100 | #155 | Good 12.0% |
| Hungarians | 70.3 /100 | #156 | Good 12.0% |
| Immigrants | Brazil | 68.8 /100 | #157 | Good 12.0% |
| Icelanders | 66.0 /100 | #158 | Good 12.0% |
| Immigrants | Barbados | 66.0 /100 | #159 | Good 12.0% |
| Immigrants | Scotland | 65.8 /100 | #160 | Good 12.0% |
| Marshallese | 64.6 /100 | #161 | Good 12.0% |
| Samoans | 64.3 /100 | #162 | Good 12.0% |
| Navajo | 63.9 /100 | #163 | Good 12.0% |
| Swiss | 63.6 /100 | #164 | Good 12.0% |
| German Russians | 61.8 /100 | #165 | Good 12.0% |
| Tohono O'odham | 60.4 /100 | #166 | Good 12.0% |
| Ethiopians | 58.5 /100 | #167 | Average 12.0% |
| Serbians | 57.1 /100 | #168 | Average 12.0% |
| Immigrants | Peru | 57.0 /100 | #169 | Average 12.0% |