Nepalese vs Immigrants from Moldova Divorced or Separated
COMPARE
Nepalese
Immigrants from Moldova
Divorced or Separated
Divorced or Separated Comparison
Nepalese
Immigrants from Moldova
12.5%
DIVORCED OR SEPARATED
1.8/ 100
METRIC RATING
248th/ 347
METRIC RANK
12.1%
DIVORCED OR SEPARATED
50.4/ 100
METRIC RATING
173rd/ 347
METRIC RANK
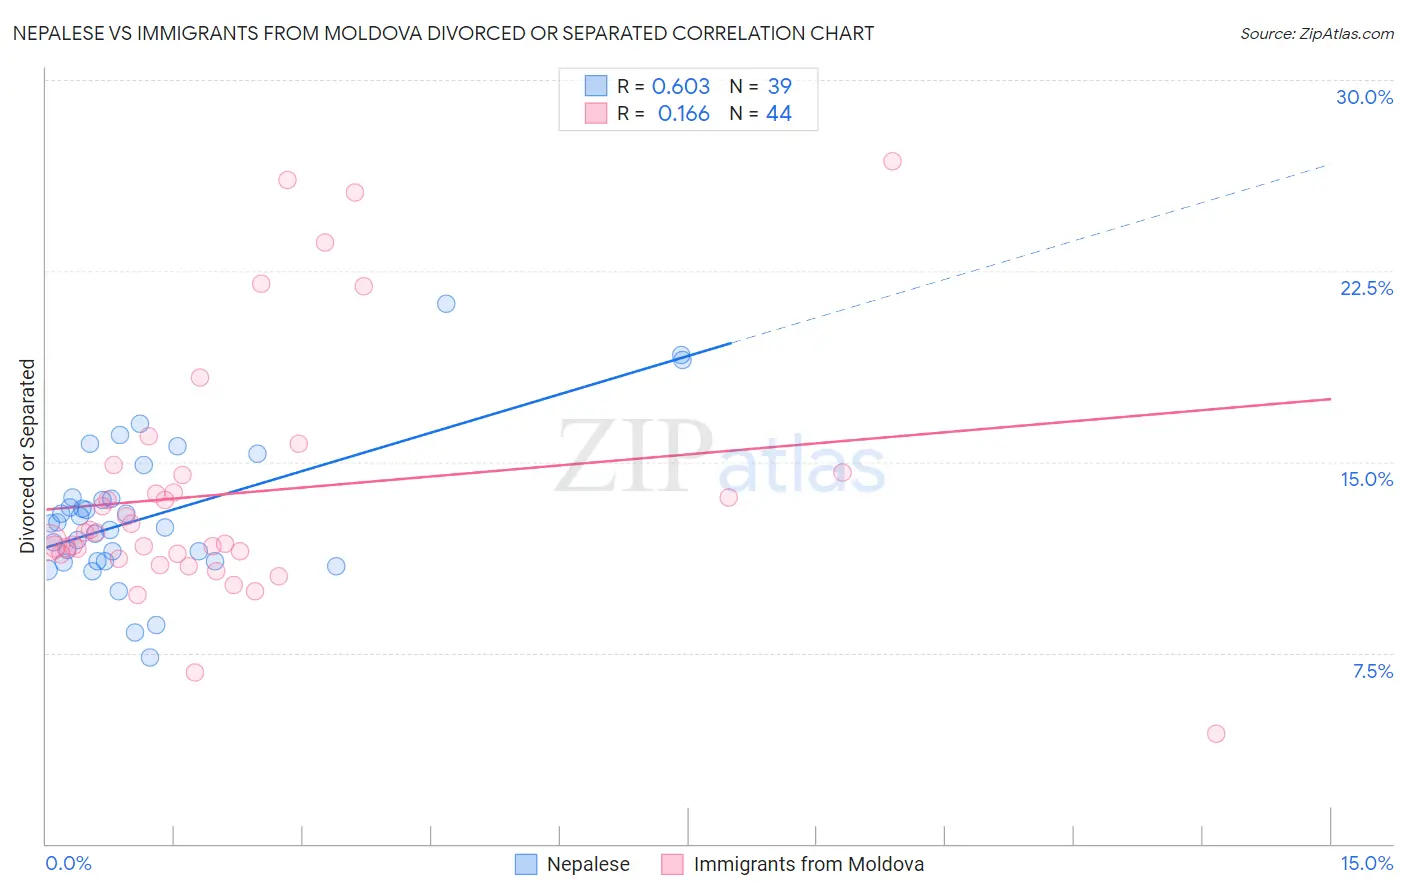
Nepalese vs Immigrants from Moldova Divorced or Separated Correlation Chart
The statistical analysis conducted on geographies consisting of 24,519,269 people shows a significant positive correlation between the proportion of Nepalese and percentage of population currently divorced or separated in the United States with a correlation coefficient (R) of 0.603 and weighted average of 12.5%. Similarly, the statistical analysis conducted on geographies consisting of 124,391,086 people shows a poor positive correlation between the proportion of Immigrants from Moldova and percentage of population currently divorced or separated in the United States with a correlation coefficient (R) of 0.166 and weighted average of 12.1%, a difference of 3.5%.
Divorced or Separated Correlation Summary
| Measurement | Nepalese | Immigrants from Moldova |
| Minimum | 7.3% | 4.3% |
| Maximum | 21.2% | 26.8% |
| Range | 13.9% | 22.5% |
| Mean | 12.9% | 13.8% |
| Median | 12.6% | 12.2% |
| Interquartile 25% (IQ1) | 11.1% | 11.4% |
| Interquartile 75% (IQ3) | 13.6% | 14.5% |
| Interquartile Range (IQR) | 2.5% | 3.2% |
| Standard Deviation (Sample) | 2.9% | 4.8% |
| Standard Deviation (Population) | 2.8% | 4.8% |
Similar Demographics by Divorced or Separated
Demographics Similar to Nepalese by Divorced or Separated
In terms of divorced or separated, the demographic groups most similar to Nepalese are Finnish (12.5%, a difference of 0.010%), German (12.5%, a difference of 0.020%), Immigrants from West Indies (12.5%, a difference of 0.060%), Hispanic or Latino (12.5%, a difference of 0.080%), and Irish (12.5%, a difference of 0.29%).
| Demographics | Rating | Rank | Divorced or Separated |
| Uruguayans | 3.4 /100 | #241 | Tragic 12.4% |
| Dutch | 3.1 /100 | #242 | Tragic 12.4% |
| Immigrants | Latin America | 2.8 /100 | #243 | Tragic 12.4% |
| Alaska Natives | 2.5 /100 | #244 | Tragic 12.4% |
| Hispanics or Latinos | 2.0 /100 | #245 | Tragic 12.5% |
| Immigrants | West Indies | 1.9 /100 | #246 | Tragic 12.5% |
| Germans | 1.8 /100 | #247 | Tragic 12.5% |
| Nepalese | 1.8 /100 | #248 | Tragic 12.5% |
| Finns | 1.8 /100 | #249 | Tragic 12.5% |
| Irish | 1.3 /100 | #250 | Tragic 12.5% |
| Aleuts | 1.3 /100 | #251 | Tragic 12.5% |
| Liberians | 0.9 /100 | #252 | Tragic 12.6% |
| Somalis | 0.9 /100 | #253 | Tragic 12.6% |
| Senegalese | 0.8 /100 | #254 | Tragic 12.6% |
| Welsh | 0.7 /100 | #255 | Tragic 12.6% |
Demographics Similar to Immigrants from Moldova by Divorced or Separated
In terms of divorced or separated, the demographic groups most similar to Immigrants from Moldova are Hawaiian (12.1%, a difference of 0.020%), Immigrants from Sierra Leone (12.1%, a difference of 0.020%), Pennsylvania German (12.1%, a difference of 0.050%), Immigrants from Mexico (12.0%, a difference of 0.090%), and Brazilian (12.1%, a difference of 0.090%).
| Demographics | Rating | Rank | Divorced or Separated |
| Tohono O'odham | 60.4 /100 | #166 | Good 12.0% |
| Ethiopians | 58.5 /100 | #167 | Average 12.0% |
| Serbians | 57.1 /100 | #168 | Average 12.0% |
| Immigrants | Peru | 57.0 /100 | #169 | Average 12.0% |
| Mexican American Indians | 55.8 /100 | #170 | Average 12.0% |
| Costa Ricans | 53.3 /100 | #171 | Average 12.0% |
| Immigrants | Mexico | 53.2 /100 | #172 | Average 12.0% |
| Immigrants | Moldova | 50.4 /100 | #173 | Average 12.1% |
| Hawaiians | 50.0 /100 | #174 | Average 12.1% |
| Immigrants | Sierra Leone | 50.0 /100 | #175 | Average 12.1% |
| Pennsylvania Germans | 48.9 /100 | #176 | Average 12.1% |
| Brazilians | 47.7 /100 | #177 | Average 12.1% |
| Ghanaians | 45.9 /100 | #178 | Average 12.1% |
| Immigrants | Western Europe | 45.6 /100 | #179 | Average 12.1% |
| Barbadians | 45.0 /100 | #180 | Average 12.1% |