Bahamian vs Immigrants from South America Divorced or Separated
COMPARE
Bahamian
Immigrants from South America
Divorced or Separated
Divorced or Separated Comparison
Bahamians
Immigrants from South America
14.2%
DIVORCED OR SEPARATED
0.0/ 100
METRIC RATING
341st/ 347
METRIC RANK
12.2%
DIVORCED OR SEPARATED
15.4/ 100
METRIC RATING
216th/ 347
METRIC RANK
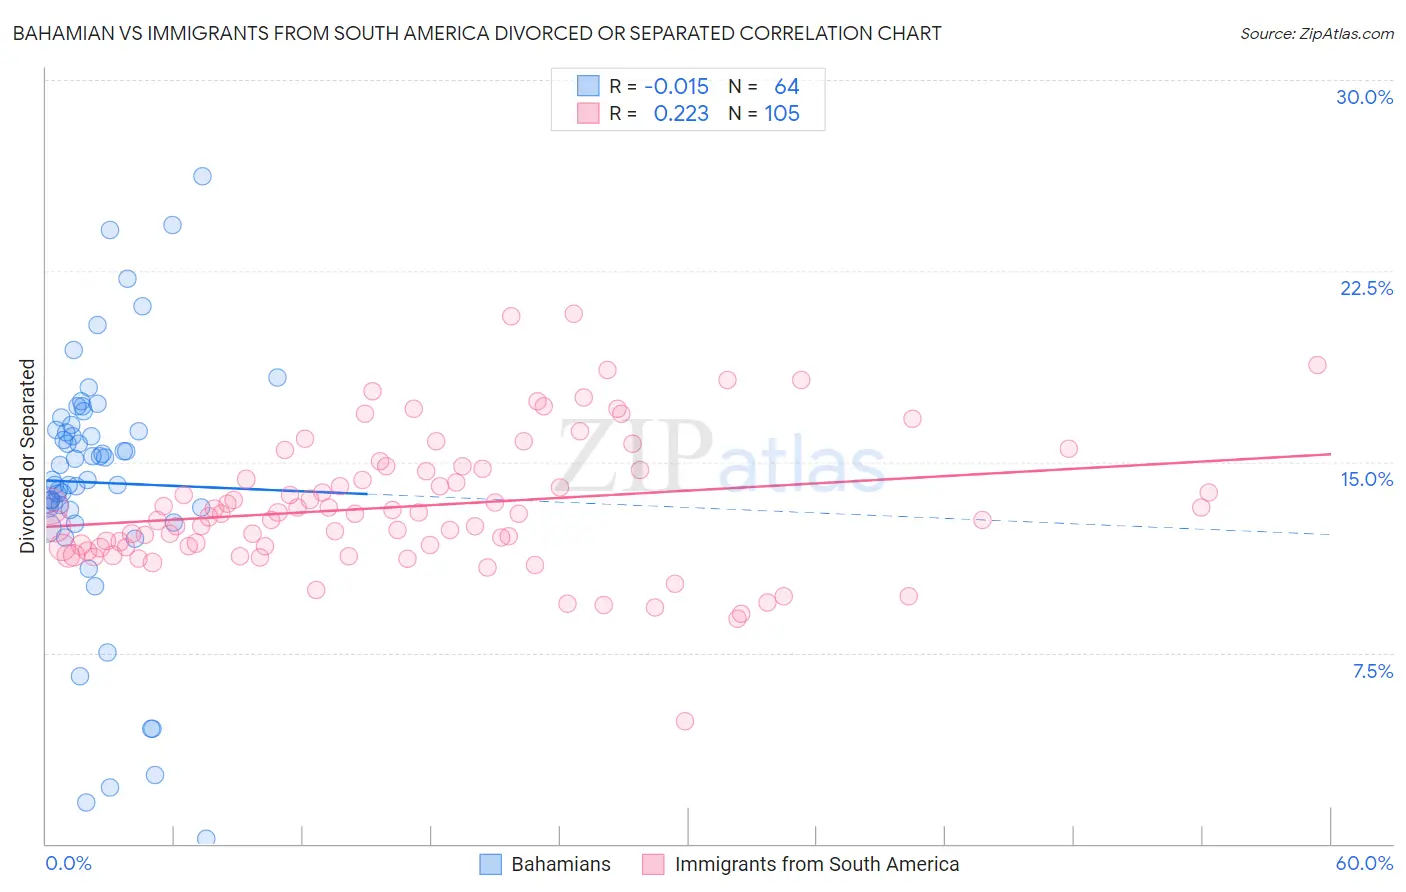
Bahamian vs Immigrants from South America Divorced or Separated Correlation Chart
The statistical analysis conducted on geographies consisting of 112,659,995 people shows no correlation between the proportion of Bahamians and percentage of population currently divorced or separated in the United States with a correlation coefficient (R) of -0.015 and weighted average of 14.2%. Similarly, the statistical analysis conducted on geographies consisting of 486,185,225 people shows a weak positive correlation between the proportion of Immigrants from South America and percentage of population currently divorced or separated in the United States with a correlation coefficient (R) of 0.223 and weighted average of 12.2%, a difference of 16.3%.
Divorced or Separated Correlation Summary
| Measurement | Bahamian | Immigrants from South America |
| Minimum | 0.20% | 4.8% |
| Maximum | 26.2% | 20.8% |
| Range | 26.0% | 16.0% |
| Mean | 14.2% | 13.3% |
| Median | 14.6% | 13.0% |
| Interquartile 25% (IQ1) | 13.1% | 11.6% |
| Interquartile 75% (IQ3) | 16.4% | 14.7% |
| Interquartile Range (IQR) | 3.2% | 3.1% |
| Standard Deviation (Sample) | 5.1% | 2.6% |
| Standard Deviation (Population) | 5.0% | 2.6% |
Similar Demographics by Divorced or Separated
Demographics Similar to Bahamians by Divorced or Separated
In terms of divorced or separated, the demographic groups most similar to Bahamians are Seminole (14.3%, a difference of 0.17%), Chickasaw (14.2%, a difference of 0.20%), Colville (14.2%, a difference of 0.24%), Choctaw (14.1%, a difference of 0.77%), and Crow (14.1%, a difference of 1.1%).
| Demographics | Rating | Rank | Divorced or Separated |
| Puerto Ricans | 0.0 /100 | #333 | Tragic 13.9% |
| Immigrants | Bahamas | 0.0 /100 | #334 | Tragic 13.9% |
| Dutch West Indians | 0.0 /100 | #335 | Tragic 14.0% |
| Shoshone | 0.0 /100 | #336 | Tragic 14.0% |
| Crow | 0.0 /100 | #337 | Tragic 14.1% |
| Choctaw | 0.0 /100 | #338 | Tragic 14.1% |
| Colville | 0.0 /100 | #339 | Tragic 14.2% |
| Chickasaw | 0.0 /100 | #340 | Tragic 14.2% |
| Bahamians | 0.0 /100 | #341 | Tragic 14.2% |
| Seminole | 0.0 /100 | #342 | Tragic 14.3% |
| Creek | 0.0 /100 | #343 | Tragic 14.4% |
| Cubans | 0.0 /100 | #344 | Tragic 14.5% |
| Kiowa | 0.0 /100 | #345 | Tragic 14.5% |
| Arapaho | 0.0 /100 | #346 | Tragic 14.8% |
| Immigrants | Cuba | 0.0 /100 | #347 | Tragic 15.2% |
Demographics Similar to Immigrants from South America by Divorced or Separated
In terms of divorced or separated, the demographic groups most similar to Immigrants from South America are European (12.2%, a difference of 0.0%), Immigrants from Argentina (12.2%, a difference of 0.010%), Northern European (12.2%, a difference of 0.040%), Immigrants from Eastern Africa (12.2%, a difference of 0.050%), and Immigrants from Kenya (12.2%, a difference of 0.070%).
| Demographics | Rating | Rank | Divorced or Separated |
| Immigrants | Trinidad and Tobago | 17.8 /100 | #209 | Poor 12.2% |
| Slavs | 17.0 /100 | #210 | Poor 12.2% |
| Trinidadians and Tobagonians | 16.6 /100 | #211 | Poor 12.2% |
| Immigrants | Kenya | 16.5 /100 | #212 | Poor 12.2% |
| Immigrants | Eastern Africa | 16.2 /100 | #213 | Poor 12.2% |
| Immigrants | Argentina | 15.5 /100 | #214 | Poor 12.2% |
| Europeans | 15.4 /100 | #215 | Poor 12.2% |
| Immigrants | South America | 15.4 /100 | #216 | Poor 12.2% |
| Northern Europeans | 14.7 /100 | #217 | Poor 12.2% |
| Slovenes | 13.2 /100 | #218 | Poor 12.3% |
| Czechoslovakians | 11.7 /100 | #219 | Poor 12.3% |
| British | 11.6 /100 | #220 | Poor 12.3% |
| Guamanians/Chamorros | 11.3 /100 | #221 | Poor 12.3% |
| Bangladeshis | 10.5 /100 | #222 | Poor 12.3% |
| Scandinavians | 10.4 /100 | #223 | Poor 12.3% |