Nepalese vs Immigrants from South America Self-Care Disability
COMPARE
Nepalese
Immigrants from South America
Self-Care Disability
Self-Care Disability Comparison
Nepalese
Immigrants from South America
3.0%
SELF-CARE DISABILITY
0.0/ 100
METRIC RATING
330th/ 347
METRIC RANK
2.4%
SELF-CARE DISABILITY
88.8/ 100
METRIC RATING
132nd/ 347
METRIC RANK
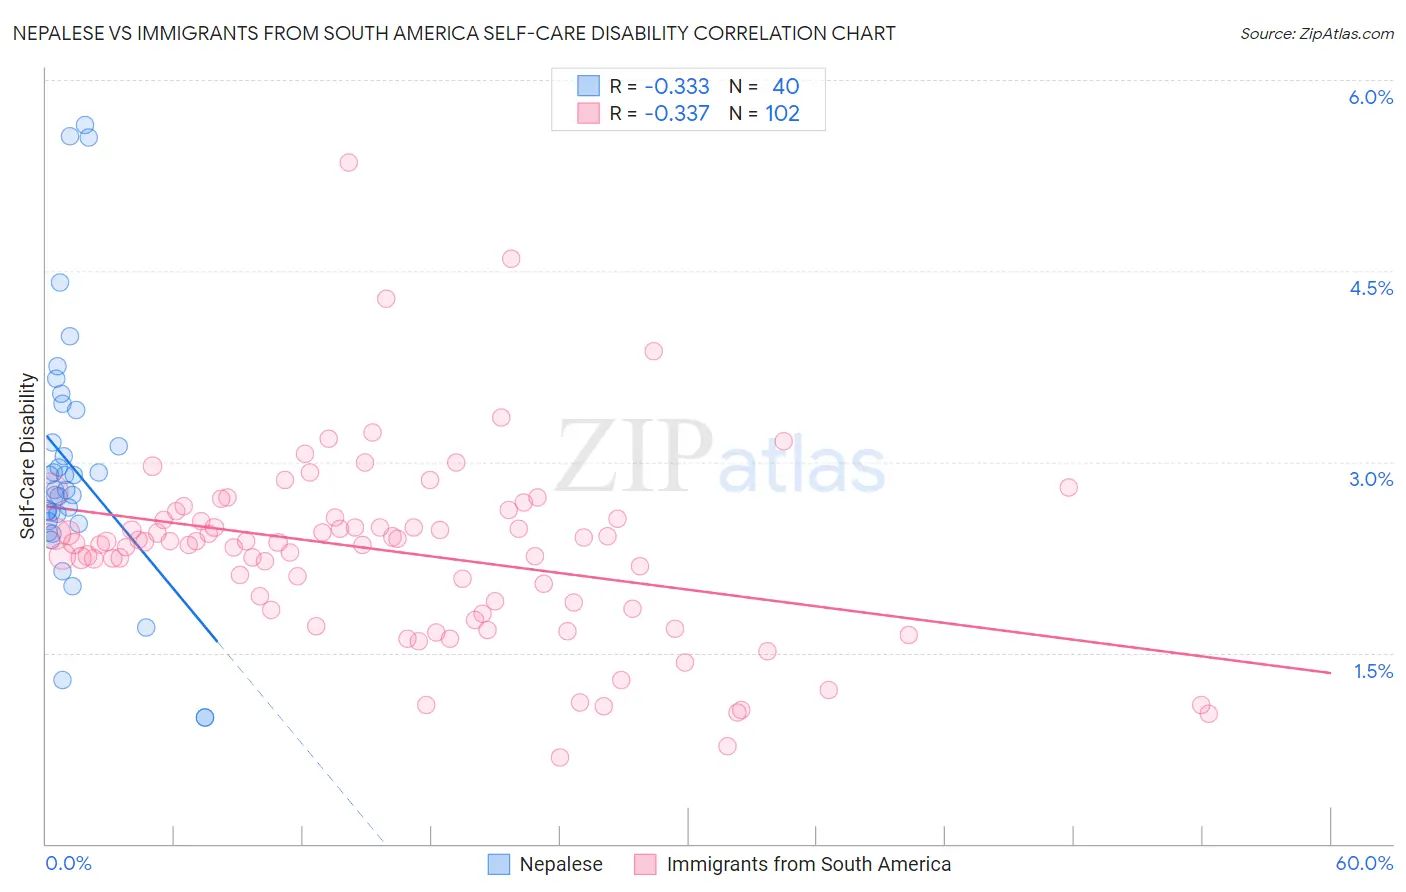
Nepalese vs Immigrants from South America Self-Care Disability Correlation Chart
The statistical analysis conducted on geographies consisting of 24,515,553 people shows a mild negative correlation between the proportion of Nepalese and percentage of population with self-care disability in the United States with a correlation coefficient (R) of -0.333 and weighted average of 3.0%. Similarly, the statistical analysis conducted on geographies consisting of 485,509,375 people shows a mild negative correlation between the proportion of Immigrants from South America and percentage of population with self-care disability in the United States with a correlation coefficient (R) of -0.337 and weighted average of 2.4%, a difference of 23.2%.
Self-Care Disability Correlation Summary
| Measurement | Nepalese | Immigrants from South America |
| Minimum | 0.99% | 0.67% |
| Maximum | 5.6% | 5.3% |
| Range | 4.7% | 4.7% |
| Mean | 3.0% | 2.3% |
| Median | 2.8% | 2.4% |
| Interquartile 25% (IQ1) | 2.5% | 1.8% |
| Interquartile 75% (IQ3) | 3.3% | 2.5% |
| Interquartile Range (IQR) | 0.76% | 0.70% |
| Standard Deviation (Sample) | 1.0% | 0.73% |
| Standard Deviation (Population) | 1.0% | 0.73% |
Similar Demographics by Self-Care Disability
Demographics Similar to Nepalese by Self-Care Disability
In terms of self-care disability, the demographic groups most similar to Nepalese are Lumbee (3.0%, a difference of 0.12%), Kiowa (3.0%, a difference of 0.47%), Dutch West Indian (3.0%, a difference of 0.71%), Cajun (2.9%, a difference of 0.75%), and Houma (3.0%, a difference of 0.78%).
| Demographics | Rating | Rank | Self-Care Disability |
| Seminole | 0.0 /100 | #323 | Tragic 2.9% |
| Cherokee | 0.0 /100 | #324 | Tragic 2.9% |
| Immigrants | Uzbekistan | 0.0 /100 | #325 | Tragic 2.9% |
| Paiute | 0.0 /100 | #326 | Tragic 2.9% |
| Blacks/African Americans | 0.0 /100 | #327 | Tragic 2.9% |
| Hopi | 0.0 /100 | #328 | Tragic 2.9% |
| Cajuns | 0.0 /100 | #329 | Tragic 2.9% |
| Nepalese | 0.0 /100 | #330 | Tragic 3.0% |
| Lumbee | 0.0 /100 | #331 | Tragic 3.0% |
| Kiowa | 0.0 /100 | #332 | Tragic 3.0% |
| Dutch West Indians | 0.0 /100 | #333 | Tragic 3.0% |
| Houma | 0.0 /100 | #334 | Tragic 3.0% |
| Immigrants | Azores | 0.0 /100 | #335 | Tragic 3.0% |
| Immigrants | Yemen | 0.0 /100 | #336 | Tragic 3.0% |
| Choctaw | 0.0 /100 | #337 | Tragic 3.0% |
Demographics Similar to Immigrants from South America by Self-Care Disability
In terms of self-care disability, the demographic groups most similar to Immigrants from South America are Polish (2.4%, a difference of 0.010%), Immigrants from Austria (2.4%, a difference of 0.030%), Immigrants from Colombia (2.4%, a difference of 0.030%), Immigrants from Romania (2.4%, a difference of 0.050%), and Russian (2.4%, a difference of 0.070%).
| Demographics | Rating | Rank | Self-Care Disability |
| Hmong | 89.9 /100 | #126 | Excellent 2.4% |
| Colombians | 89.7 /100 | #127 | Excellent 2.4% |
| Immigrants | Hungary | 89.6 /100 | #128 | Excellent 2.4% |
| Immigrants | Romania | 89.3 /100 | #129 | Excellent 2.4% |
| Immigrants | Austria | 89.0 /100 | #130 | Excellent 2.4% |
| Poles | 88.9 /100 | #131 | Excellent 2.4% |
| Immigrants | South America | 88.8 /100 | #132 | Excellent 2.4% |
| Immigrants | Colombia | 88.5 /100 | #133 | Excellent 2.4% |
| Russians | 88.2 /100 | #134 | Excellent 2.4% |
| Laotians | 87.8 /100 | #135 | Excellent 2.4% |
| South American Indians | 87.2 /100 | #136 | Excellent 2.4% |
| Austrians | 87.0 /100 | #137 | Excellent 2.4% |
| Immigrants | Croatia | 86.6 /100 | #138 | Excellent 2.4% |
| Sri Lankans | 86.6 /100 | #139 | Excellent 2.4% |