Scotch-Irish vs Immigrants from South America Divorced or Separated
COMPARE
Scotch-Irish
Immigrants from South America
Divorced or Separated
Divorced or Separated Comparison
Scotch-Irish
Immigrants from South America
12.9%
DIVORCED OR SEPARATED
0.0/ 100
METRIC RATING
292nd/ 347
METRIC RANK
12.2%
DIVORCED OR SEPARATED
15.4/ 100
METRIC RATING
216th/ 347
METRIC RANK
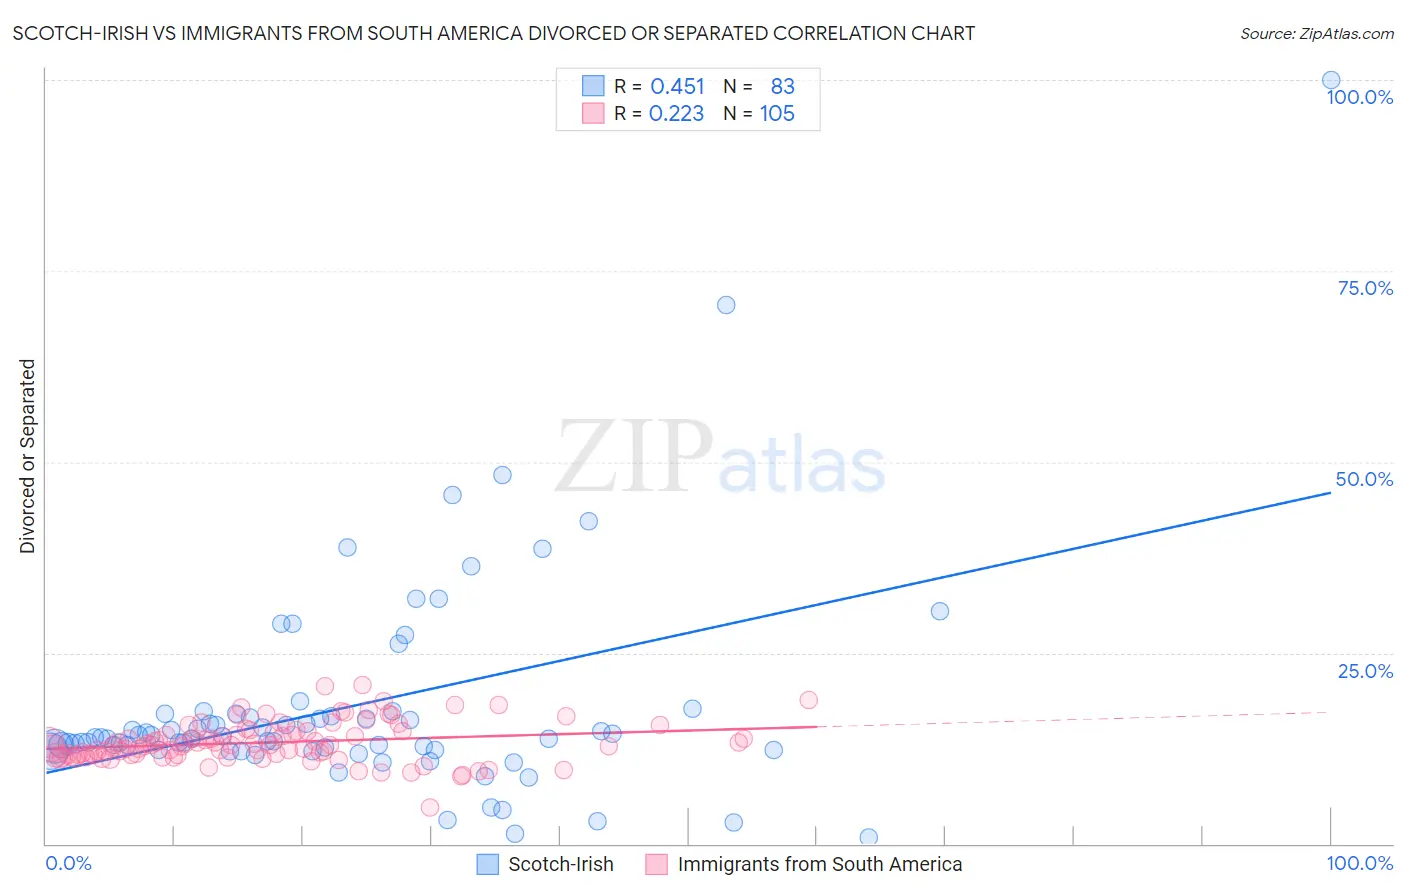
Scotch-Irish vs Immigrants from South America Divorced or Separated Correlation Chart
The statistical analysis conducted on geographies consisting of 548,485,641 people shows a moderate positive correlation between the proportion of Scotch-Irish and percentage of population currently divorced or separated in the United States with a correlation coefficient (R) of 0.451 and weighted average of 12.9%. Similarly, the statistical analysis conducted on geographies consisting of 486,185,225 people shows a weak positive correlation between the proportion of Immigrants from South America and percentage of population currently divorced or separated in the United States with a correlation coefficient (R) of 0.223 and weighted average of 12.2%, a difference of 5.5%.
Divorced or Separated Correlation Summary
| Measurement | Scotch-Irish | Immigrants from South America |
| Minimum | 0.80% | 4.8% |
| Maximum | 100.0% | 20.8% |
| Range | 99.2% | 16.0% |
| Mean | 17.9% | 13.3% |
| Median | 13.9% | 13.0% |
| Interquartile 25% (IQ1) | 12.3% | 11.6% |
| Interquartile 75% (IQ3) | 17.0% | 14.7% |
| Interquartile Range (IQR) | 4.7% | 3.1% |
| Standard Deviation (Sample) | 14.3% | 2.6% |
| Standard Deviation (Population) | 14.2% | 2.6% |
Similar Demographics by Divorced or Separated
Demographics Similar to Scotch-Irish by Divorced or Separated
In terms of divorced or separated, the demographic groups most similar to Scotch-Irish are Immigrants from Honduras (12.9%, a difference of 0.060%), Pima (12.9%, a difference of 0.17%), Jamaican (12.9%, a difference of 0.21%), Apache (12.9%, a difference of 0.24%), and Iroquois (12.9%, a difference of 0.32%).
| Demographics | Rating | Rank | Divorced or Separated |
| French | 0.1 /100 | #285 | Tragic 12.8% |
| Spanish | 0.1 /100 | #286 | Tragic 12.8% |
| Hondurans | 0.1 /100 | #287 | Tragic 12.8% |
| French Canadians | 0.1 /100 | #288 | Tragic 12.8% |
| Iroquois | 0.0 /100 | #289 | Tragic 12.9% |
| Pima | 0.0 /100 | #290 | Tragic 12.9% |
| Immigrants | Honduras | 0.0 /100 | #291 | Tragic 12.9% |
| Scotch-Irish | 0.0 /100 | #292 | Tragic 12.9% |
| Jamaicans | 0.0 /100 | #293 | Tragic 12.9% |
| Apache | 0.0 /100 | #294 | Tragic 12.9% |
| Celtics | 0.0 /100 | #295 | Tragic 13.0% |
| Nicaraguans | 0.0 /100 | #296 | Tragic 13.0% |
| Natives/Alaskans | 0.0 /100 | #297 | Tragic 13.0% |
| Venezuelans | 0.0 /100 | #298 | Tragic 13.0% |
| Immigrants | Jamaica | 0.0 /100 | #299 | Tragic 13.0% |
Demographics Similar to Immigrants from South America by Divorced or Separated
In terms of divorced or separated, the demographic groups most similar to Immigrants from South America are European (12.2%, a difference of 0.0%), Immigrants from Argentina (12.2%, a difference of 0.010%), Northern European (12.2%, a difference of 0.040%), Immigrants from Eastern Africa (12.2%, a difference of 0.050%), and Immigrants from Kenya (12.2%, a difference of 0.070%).
| Demographics | Rating | Rank | Divorced or Separated |
| Immigrants | Trinidad and Tobago | 17.8 /100 | #209 | Poor 12.2% |
| Slavs | 17.0 /100 | #210 | Poor 12.2% |
| Trinidadians and Tobagonians | 16.6 /100 | #211 | Poor 12.2% |
| Immigrants | Kenya | 16.5 /100 | #212 | Poor 12.2% |
| Immigrants | Eastern Africa | 16.2 /100 | #213 | Poor 12.2% |
| Immigrants | Argentina | 15.5 /100 | #214 | Poor 12.2% |
| Europeans | 15.4 /100 | #215 | Poor 12.2% |
| Immigrants | South America | 15.4 /100 | #216 | Poor 12.2% |
| Northern Europeans | 14.7 /100 | #217 | Poor 12.2% |
| Slovenes | 13.2 /100 | #218 | Poor 12.3% |
| Czechoslovakians | 11.7 /100 | #219 | Poor 12.3% |
| British | 11.6 /100 | #220 | Poor 12.3% |
| Guamanians/Chamorros | 11.3 /100 | #221 | Poor 12.3% |
| Bangladeshis | 10.5 /100 | #222 | Poor 12.3% |
| Scandinavians | 10.4 /100 | #223 | Poor 12.3% |