Latvian vs Immigrants from Serbia Average Family Size
COMPARE
Latvian
Immigrants from Serbia
Average Family Size
Average Family Size Comparison
Latvians
Immigrants from Serbia
3.11
AVERAGE FAMILY SIZE
0.0/ 100
METRIC RATING
330th/ 347
METRIC RANK
3.13
AVERAGE FAMILY SIZE
0.1/ 100
METRIC RATING
307th/ 347
METRIC RANK
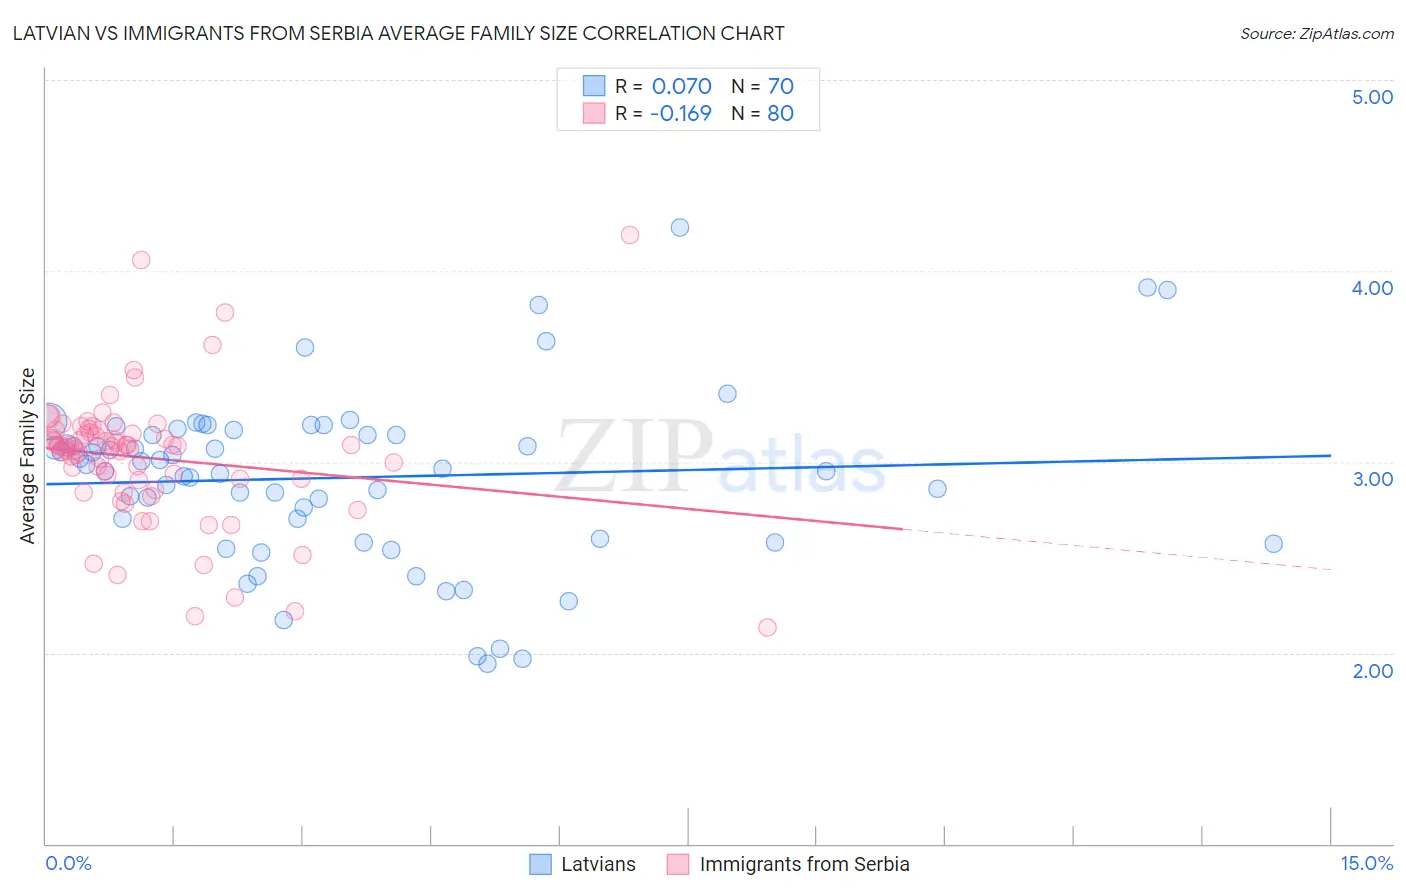
Latvian vs Immigrants from Serbia Average Family Size Correlation Chart
The statistical analysis conducted on geographies consisting of 220,660,131 people shows a slight positive correlation between the proportion of Latvians and average family size in the United States with a correlation coefficient (R) of 0.070 and weighted average of 3.11. Similarly, the statistical analysis conducted on geographies consisting of 131,725,495 people shows a poor negative correlation between the proportion of Immigrants from Serbia and average family size in the United States with a correlation coefficient (R) of -0.169 and weighted average of 3.13, a difference of 0.80%.
Average Family Size Correlation Summary
| Measurement | Latvian | Immigrants from Serbia |
| Minimum | 1.94 | 2.13 |
| Maximum | 4.23 | 4.19 |
| Range | 2.29 | 2.06 |
| Mean | 2.92 | 3.02 |
| Median | 2.97 | 3.08 |
| Interquartile 25% (IQ1) | 2.60 | 2.91 |
| Interquartile 75% (IQ3) | 3.14 | 3.15 |
| Interquartile Range (IQR) | 0.54 | 0.24 |
| Standard Deviation (Sample) | 0.45 | 0.34 |
| Standard Deviation (Population) | 0.45 | 0.34 |
Similar Demographics by Average Family Size
Demographics Similar to Latvians by Average Family Size
In terms of average family size, the demographic groups most similar to Latvians are Scotch-Irish (3.11, a difference of 0.0%), Scottish (3.11, a difference of 0.010%), Estonian (3.10, a difference of 0.050%), Belgian (3.11, a difference of 0.060%), and Lithuanian (3.10, a difference of 0.060%).
| Demographics | Rating | Rank | Average Family Size |
| Soviet Union | 0.0 /100 | #323 | Tragic 3.11 |
| Celtics | 0.0 /100 | #324 | Tragic 3.11 |
| English | 0.0 /100 | #325 | Tragic 3.11 |
| Ottawa | 0.0 /100 | #326 | Tragic 3.11 |
| Dutch | 0.0 /100 | #327 | Tragic 3.11 |
| Czechs | 0.0 /100 | #328 | Tragic 3.11 |
| Belgians | 0.0 /100 | #329 | Tragic 3.11 |
| Latvians | 0.0 /100 | #330 | Tragic 3.11 |
| Scotch-Irish | 0.0 /100 | #331 | Tragic 3.11 |
| Scottish | 0.0 /100 | #332 | Tragic 3.11 |
| Estonians | 0.0 /100 | #333 | Tragic 3.10 |
| Lithuanians | 0.0 /100 | #334 | Tragic 3.10 |
| Luxembourgers | 0.0 /100 | #335 | Tragic 3.10 |
| Irish | 0.0 /100 | #336 | Tragic 3.10 |
| Swedes | 0.0 /100 | #337 | Tragic 3.10 |
Demographics Similar to Immigrants from Serbia by Average Family Size
In terms of average family size, the demographic groups most similar to Immigrants from Serbia are Immigrants from Ireland (3.13, a difference of 0.010%), Slavic (3.13, a difference of 0.050%), Northern European (3.13, a difference of 0.060%), Australian (3.13, a difference of 0.070%), and Czechoslovakian (3.13, a difference of 0.080%).
| Demographics | Rating | Rank | Average Family Size |
| Immigrants | Sweden | 0.2 /100 | #300 | Tragic 3.14 |
| Macedonians | 0.2 /100 | #301 | Tragic 3.13 |
| Immigrants | Latvia | 0.2 /100 | #302 | Tragic 3.13 |
| British | 0.2 /100 | #303 | Tragic 3.13 |
| Immigrants | Switzerland | 0.2 /100 | #304 | Tragic 3.13 |
| Australians | 0.1 /100 | #305 | Tragic 3.13 |
| Immigrants | Ireland | 0.1 /100 | #306 | Tragic 3.13 |
| Immigrants | Serbia | 0.1 /100 | #307 | Tragic 3.13 |
| Slavs | 0.1 /100 | #308 | Tragic 3.13 |
| Northern Europeans | 0.1 /100 | #309 | Tragic 3.13 |
| Czechoslovakians | 0.1 /100 | #310 | Tragic 3.13 |
| Immigrants | Northern Europe | 0.1 /100 | #311 | Tragic 3.13 |
| Immigrants | Australia | 0.1 /100 | #312 | Tragic 3.13 |
| Bulgarians | 0.1 /100 | #313 | Tragic 3.13 |
| Russians | 0.1 /100 | #314 | Tragic 3.12 |