Immigrants from Dominican Republic vs Immigrants from Serbia Average Family Size
COMPARE
Immigrants from Dominican Republic
Immigrants from Serbia
Average Family Size
Average Family Size Comparison
Immigrants from Dominican Republic
Immigrants from Serbia
3.35
AVERAGE FAMILY SIZE
100.0/ 100
METRIC RATING
56th/ 347
METRIC RANK
3.13
AVERAGE FAMILY SIZE
0.1/ 100
METRIC RATING
307th/ 347
METRIC RANK
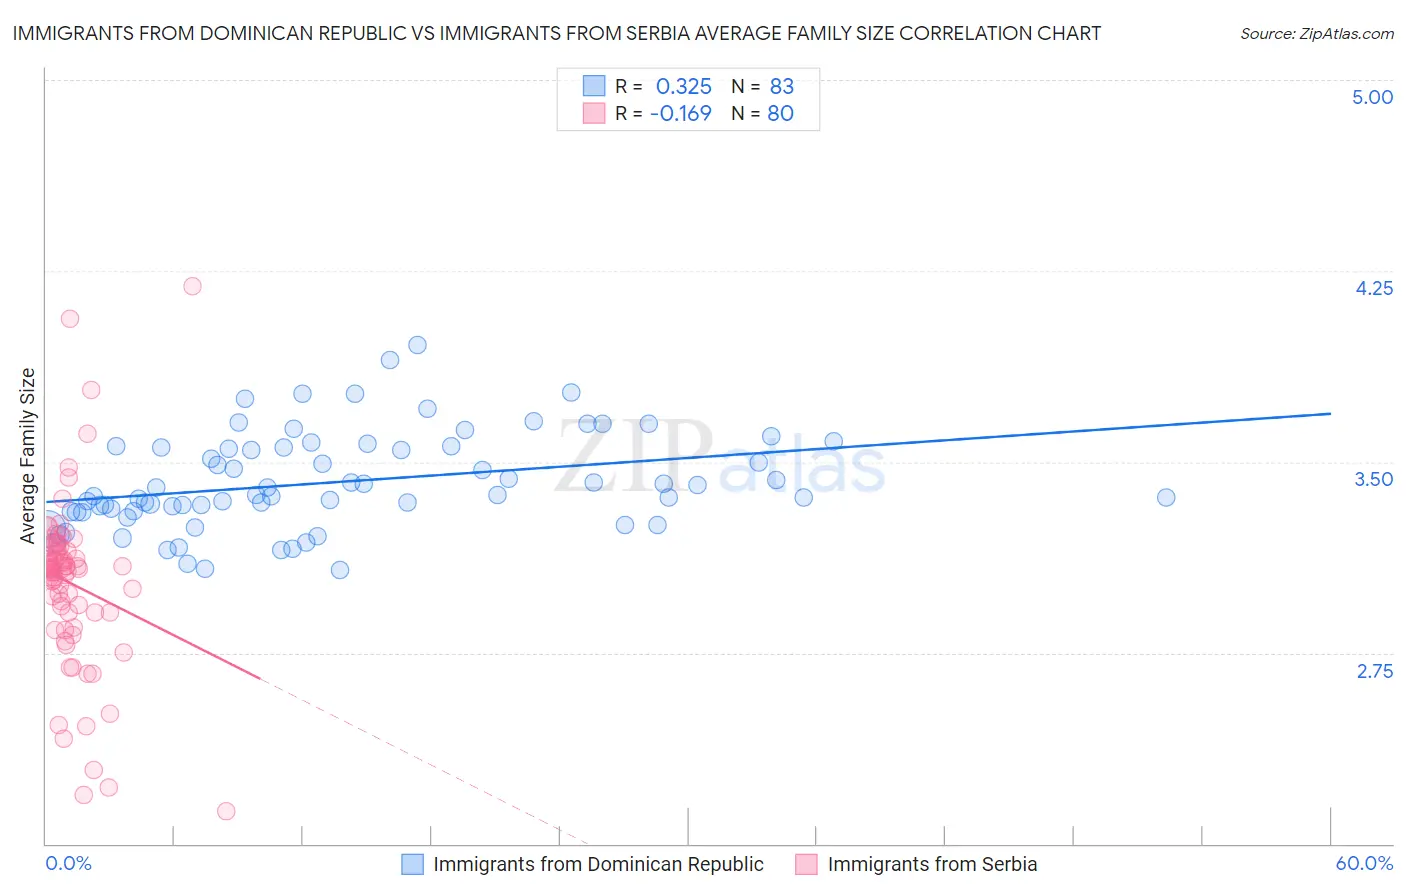
Immigrants from Dominican Republic vs Immigrants from Serbia Average Family Size Correlation Chart
The statistical analysis conducted on geographies consisting of 274,968,505 people shows a mild positive correlation between the proportion of Immigrants from Dominican Republic and average family size in the United States with a correlation coefficient (R) of 0.325 and weighted average of 3.35. Similarly, the statistical analysis conducted on geographies consisting of 131,725,495 people shows a poor negative correlation between the proportion of Immigrants from Serbia and average family size in the United States with a correlation coefficient (R) of -0.169 and weighted average of 3.13, a difference of 7.1%.
Average Family Size Correlation Summary
| Measurement | Immigrants from Dominican Republic | Immigrants from Serbia |
| Minimum | 3.07 | 2.13 |
| Maximum | 3.96 | 4.19 |
| Range | 0.89 | 2.06 |
| Mean | 3.42 | 3.02 |
| Median | 3.37 | 3.08 |
| Interquartile 25% (IQ1) | 3.30 | 2.91 |
| Interquartile 75% (IQ3) | 3.56 | 3.15 |
| Interquartile Range (IQR) | 0.25 | 0.24 |
| Standard Deviation (Sample) | 0.19 | 0.34 |
| Standard Deviation (Population) | 0.19 | 0.34 |
Similar Demographics by Average Family Size
Demographics Similar to Immigrants from Dominican Republic by Average Family Size
In terms of average family size, the demographic groups most similar to Immigrants from Dominican Republic are Sri Lankan (3.35, a difference of 0.060%), Honduran (3.35, a difference of 0.060%), Immigrants from Honduras (3.36, a difference of 0.070%), Immigrants from South Eastern Asia (3.36, a difference of 0.11%), and Korean (3.36, a difference of 0.12%).
| Demographics | Rating | Rank | Average Family Size |
| Bangladeshis | 100.0 /100 | #49 | Exceptional 3.37 |
| Immigrants | Bangladesh | 100.0 /100 | #50 | Exceptional 3.36 |
| Nicaraguans | 100.0 /100 | #51 | Exceptional 3.36 |
| Fijians | 100.0 /100 | #52 | Exceptional 3.36 |
| Koreans | 100.0 /100 | #53 | Exceptional 3.36 |
| Immigrants | South Eastern Asia | 100.0 /100 | #54 | Exceptional 3.36 |
| Immigrants | Honduras | 100.0 /100 | #55 | Exceptional 3.36 |
| Immigrants | Dominican Republic | 100.0 /100 | #56 | Exceptional 3.35 |
| Sri Lankans | 100.0 /100 | #57 | Exceptional 3.35 |
| Hondurans | 100.0 /100 | #58 | Exceptional 3.35 |
| Japanese | 100.0 /100 | #59 | Exceptional 3.35 |
| Immigrants | Armenia | 100.0 /100 | #60 | Exceptional 3.35 |
| Central American Indians | 100.0 /100 | #61 | Exceptional 3.35 |
| Immigrants | Grenada | 100.0 /100 | #62 | Exceptional 3.34 |
| Chinese | 100.0 /100 | #63 | Exceptional 3.34 |
Demographics Similar to Immigrants from Serbia by Average Family Size
In terms of average family size, the demographic groups most similar to Immigrants from Serbia are Immigrants from Ireland (3.13, a difference of 0.010%), Slavic (3.13, a difference of 0.050%), Northern European (3.13, a difference of 0.060%), Australian (3.13, a difference of 0.070%), and Czechoslovakian (3.13, a difference of 0.080%).
| Demographics | Rating | Rank | Average Family Size |
| Immigrants | Sweden | 0.2 /100 | #300 | Tragic 3.14 |
| Macedonians | 0.2 /100 | #301 | Tragic 3.13 |
| Immigrants | Latvia | 0.2 /100 | #302 | Tragic 3.13 |
| British | 0.2 /100 | #303 | Tragic 3.13 |
| Immigrants | Switzerland | 0.2 /100 | #304 | Tragic 3.13 |
| Australians | 0.1 /100 | #305 | Tragic 3.13 |
| Immigrants | Ireland | 0.1 /100 | #306 | Tragic 3.13 |
| Immigrants | Serbia | 0.1 /100 | #307 | Tragic 3.13 |
| Slavs | 0.1 /100 | #308 | Tragic 3.13 |
| Northern Europeans | 0.1 /100 | #309 | Tragic 3.13 |
| Czechoslovakians | 0.1 /100 | #310 | Tragic 3.13 |
| Immigrants | Northern Europe | 0.1 /100 | #311 | Tragic 3.13 |
| Immigrants | Australia | 0.1 /100 | #312 | Tragic 3.13 |
| Bulgarians | 0.1 /100 | #313 | Tragic 3.13 |
| Russians | 0.1 /100 | #314 | Tragic 3.12 |