Nepalese vs Czech Disability Age 35 to 64
COMPARE
Nepalese
Czech
Disability Age 35 to 64
Disability Age 35 to 64 Comparison
Nepalese
Czechs
12.8%
DISABILITY AGE 35 TO 64
0.1/ 100
METRIC RATING
271st/ 347
METRIC RANK
11.3%
DISABILITY AGE 35 TO 64
47.9/ 100
METRIC RATING
175th/ 347
METRIC RANK
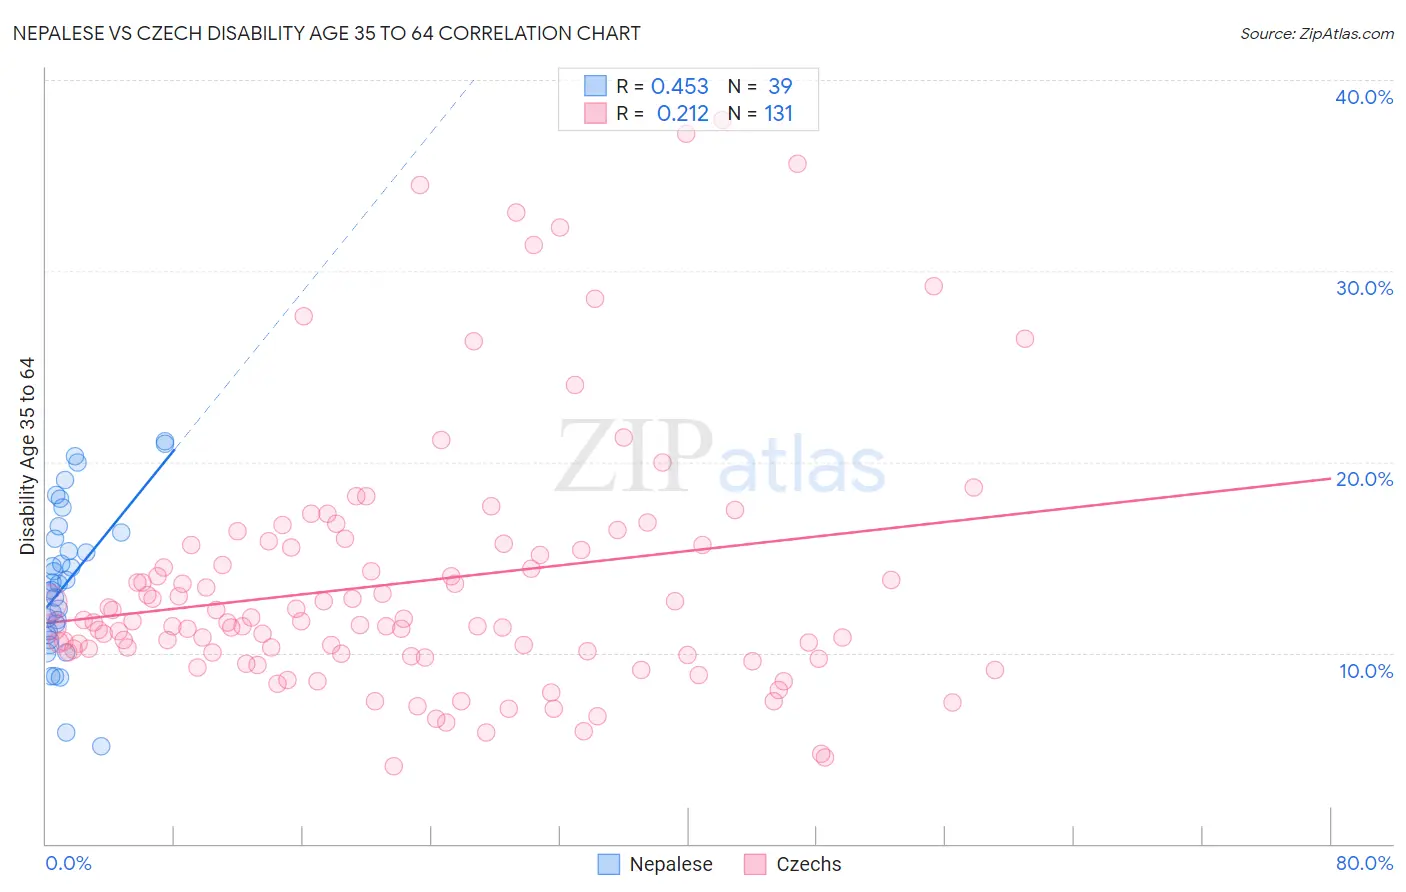
Nepalese vs Czech Disability Age 35 to 64 Correlation Chart
The statistical analysis conducted on geographies consisting of 24,500,920 people shows a moderate positive correlation between the proportion of Nepalese and percentage of population with a disability between the ages 34 and 64 in the United States with a correlation coefficient (R) of 0.453 and weighted average of 12.8%. Similarly, the statistical analysis conducted on geographies consisting of 484,309,618 people shows a weak positive correlation between the proportion of Czechs and percentage of population with a disability between the ages 34 and 64 in the United States with a correlation coefficient (R) of 0.212 and weighted average of 11.3%, a difference of 13.6%.
Disability Age 35 to 64 Correlation Summary
| Measurement | Nepalese | Czech |
| Minimum | 5.1% | 4.1% |
| Maximum | 21.1% | 37.9% |
| Range | 16.0% | 33.8% |
| Mean | 13.7% | 13.7% |
| Median | 13.6% | 11.6% |
| Interquartile 25% (IQ1) | 10.9% | 9.9% |
| Interquartile 75% (IQ3) | 16.3% | 15.6% |
| Interquartile Range (IQR) | 5.3% | 5.7% |
| Standard Deviation (Sample) | 3.9% | 6.8% |
| Standard Deviation (Population) | 3.9% | 6.8% |
Similar Demographics by Disability Age 35 to 64
Demographics Similar to Nepalese by Disability Age 35 to 64
In terms of disability age 35 to 64, the demographic groups most similar to Nepalese are U.S. Virgin Islander (12.8%, a difference of 0.12%), Pennsylvania German (12.8%, a difference of 0.21%), Celtic (12.9%, a difference of 0.23%), Dominican (12.9%, a difference of 0.37%), and Somali (12.9%, a difference of 0.49%).
| Demographics | Rating | Rank | Disability Age 35 to 64 |
| Immigrants | Portugal | 0.4 /100 | #264 | Tragic 12.5% |
| Marshallese | 0.4 /100 | #265 | Tragic 12.5% |
| Whites/Caucasians | 0.3 /100 | #266 | Tragic 12.6% |
| Sub-Saharan Africans | 0.2 /100 | #267 | Tragic 12.6% |
| Immigrants | Dominica | 0.2 /100 | #268 | Tragic 12.7% |
| Spanish | 0.2 /100 | #269 | Tragic 12.7% |
| French | 0.2 /100 | #270 | Tragic 12.7% |
| Nepalese | 0.1 /100 | #271 | Tragic 12.8% |
| U.S. Virgin Islanders | 0.1 /100 | #272 | Tragic 12.8% |
| Pennsylvania Germans | 0.1 /100 | #273 | Tragic 12.8% |
| Celtics | 0.1 /100 | #274 | Tragic 12.9% |
| Dominicans | 0.1 /100 | #275 | Tragic 12.9% |
| Somalis | 0.1 /100 | #276 | Tragic 12.9% |
| Immigrants | Dominican Republic | 0.1 /100 | #277 | Tragic 12.9% |
| French Canadians | 0.1 /100 | #278 | Tragic 12.9% |
Demographics Similar to Czechs by Disability Age 35 to 64
In terms of disability age 35 to 64, the demographic groups most similar to Czechs are Immigrants from Fiji (11.3%, a difference of 0.17%), Lebanese (11.3%, a difference of 0.31%), Ugandan (11.3%, a difference of 0.34%), Immigrants from Eastern Africa (11.3%, a difference of 0.46%), and Polish (11.3%, a difference of 0.48%).
| Demographics | Rating | Rank | Disability Age 35 to 64 |
| Central Americans | 59.1 /100 | #168 | Average 11.2% |
| Haitians | 59.0 /100 | #169 | Average 11.2% |
| Immigrants | Uganda | 58.0 /100 | #170 | Average 11.2% |
| Immigrants | Trinidad and Tobago | 55.9 /100 | #171 | Average 11.2% |
| Italians | 55.6 /100 | #172 | Average 11.2% |
| Lebanese | 51.8 /100 | #173 | Average 11.3% |
| Immigrants | Fiji | 50.0 /100 | #174 | Average 11.3% |
| Czechs | 47.9 /100 | #175 | Average 11.3% |
| Ugandans | 43.7 /100 | #176 | Average 11.3% |
| Immigrants | Eastern Africa | 42.2 /100 | #177 | Average 11.3% |
| Poles | 42.0 /100 | #178 | Average 11.3% |
| Immigrants | Barbados | 41.6 /100 | #179 | Average 11.3% |
| Immigrants | Caribbean | 41.5 /100 | #180 | Average 11.3% |
| Trinidadians and Tobagonians | 40.8 /100 | #181 | Average 11.4% |
| Icelanders | 39.7 /100 | #182 | Fair 11.4% |