Immigrants from Burma/Myanmar vs Vietnamese Single Father Households
COMPARE
Immigrants from Burma/Myanmar
Vietnamese
Single Father Households
Single Father Households Comparison
Immigrants from Burma/Myanmar
Vietnamese
2.4%
SINGLE FATHER HOUSEHOLDS
12.1/ 100
METRIC RATING
221st/ 347
METRIC RANK
2.0%
SINGLE FATHER HOUSEHOLDS
99.9/ 100
METRIC RATING
61st/ 347
METRIC RANK
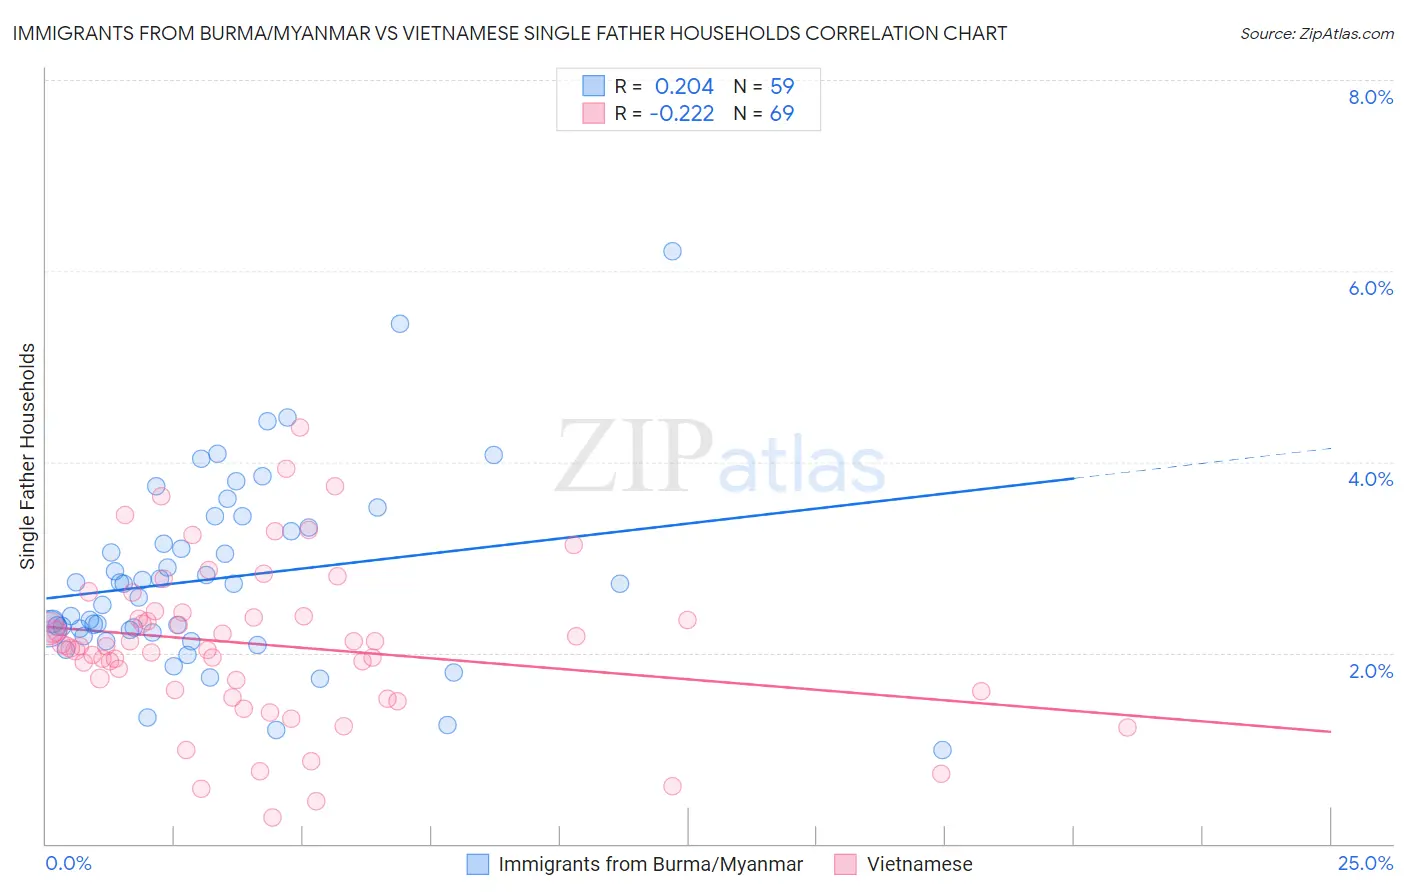
Immigrants from Burma/Myanmar vs Vietnamese Single Father Households Correlation Chart
The statistical analysis conducted on geographies consisting of 171,785,459 people shows a weak positive correlation between the proportion of Immigrants from Burma/Myanmar and percentage of single father households in the United States with a correlation coefficient (R) of 0.204 and weighted average of 2.4%. Similarly, the statistical analysis conducted on geographies consisting of 170,091,169 people shows a weak negative correlation between the proportion of Vietnamese and percentage of single father households in the United States with a correlation coefficient (R) of -0.222 and weighted average of 2.0%, a difference of 18.7%.
Single Father Households Correlation Summary
| Measurement | Immigrants from Burma/Myanmar | Vietnamese |
| Minimum | 0.98% | 0.28% |
| Maximum | 6.2% | 4.4% |
| Range | 5.2% | 4.1% |
| Mean | 2.8% | 2.1% |
| Median | 2.7% | 2.1% |
| Interquartile 25% (IQ1) | 2.2% | 1.6% |
| Interquartile 75% (IQ3) | 3.3% | 2.4% |
| Interquartile Range (IQR) | 1.1% | 0.79% |
| Standard Deviation (Sample) | 0.98% | 0.82% |
| Standard Deviation (Population) | 0.97% | 0.82% |
Similar Demographics by Single Father Households
Demographics Similar to Immigrants from Burma/Myanmar by Single Father Households
In terms of single father households, the demographic groups most similar to Immigrants from Burma/Myanmar are Immigrants from Eastern Africa (2.4%, a difference of 0.030%), Ghanaian (2.4%, a difference of 0.13%), Sudanese (2.4%, a difference of 0.14%), Immigrants from Uruguay (2.4%, a difference of 0.19%), and Immigrants from Ethiopia (2.4%, a difference of 0.21%).
| Demographics | Rating | Rank | Single Father Households |
| Ethiopians | 16.6 /100 | #214 | Poor 2.4% |
| Immigrants | South Eastern Asia | 15.9 /100 | #215 | Poor 2.4% |
| Immigrants | Ecuador | 14.9 /100 | #216 | Poor 2.4% |
| Dutch | 14.3 /100 | #217 | Poor 2.4% |
| Immigrants | Ethiopia | 13.4 /100 | #218 | Poor 2.4% |
| Sudanese | 13.0 /100 | #219 | Poor 2.4% |
| Ghanaians | 12.9 /100 | #220 | Poor 2.4% |
| Immigrants | Burma/Myanmar | 12.1 /100 | #221 | Poor 2.4% |
| Immigrants | Eastern Africa | 11.9 /100 | #222 | Poor 2.4% |
| Immigrants | Uruguay | 11.0 /100 | #223 | Poor 2.4% |
| Immigrants | Bahamas | 10.6 /100 | #224 | Poor 2.4% |
| Marshallese | 9.7 /100 | #225 | Tragic 2.4% |
| Blacks/African Americans | 9.7 /100 | #226 | Tragic 2.4% |
| Americans | 9.3 /100 | #227 | Tragic 2.4% |
| Immigrants | Ghana | 9.1 /100 | #228 | Tragic 2.4% |
Demographics Similar to Vietnamese by Single Father Households
In terms of single father households, the demographic groups most similar to Vietnamese are Immigrants from Malaysia (2.0%, a difference of 0.20%), Immigrants from Austria (2.0%, a difference of 0.24%), Immigrants from North Macedonia (2.0%, a difference of 0.25%), Immigrants from Czechoslovakia (2.0%, a difference of 0.35%), and Burmese (2.0%, a difference of 0.38%).
| Demographics | Rating | Rank | Single Father Households |
| Immigrants | Korea | 99.9 /100 | #54 | Exceptional 2.0% |
| Immigrants | France | 99.9 /100 | #55 | Exceptional 2.0% |
| Immigrants | Norway | 99.9 /100 | #56 | Exceptional 2.0% |
| Burmese | 99.9 /100 | #57 | Exceptional 2.0% |
| Immigrants | Czechoslovakia | 99.9 /100 | #58 | Exceptional 2.0% |
| Immigrants | North Macedonia | 99.9 /100 | #59 | Exceptional 2.0% |
| Immigrants | Austria | 99.9 /100 | #60 | Exceptional 2.0% |
| Vietnamese | 99.9 /100 | #61 | Exceptional 2.0% |
| Immigrants | Malaysia | 99.9 /100 | #62 | Exceptional 2.0% |
| Maltese | 99.9 /100 | #63 | Exceptional 2.0% |
| Mongolians | 99.9 /100 | #64 | Exceptional 2.1% |
| Paraguayans | 99.9 /100 | #65 | Exceptional 2.1% |
| Immigrants | Western Asia | 99.8 /100 | #66 | Exceptional 2.1% |
| Immigrants | Italy | 99.8 /100 | #67 | Exceptional 2.1% |
| Immigrants | Denmark | 99.8 /100 | #68 | Exceptional 2.1% |