Navajo vs Immigrants from Kenya Divorced or Separated
COMPARE
Navajo
Immigrants from Kenya
Divorced or Separated
Divorced or Separated Comparison
Navajo
Immigrants from Kenya
12.0%
DIVORCED OR SEPARATED
63.9/ 100
METRIC RATING
163rd/ 347
METRIC RANK
12.2%
DIVORCED OR SEPARATED
16.5/ 100
METRIC RATING
212th/ 347
METRIC RANK
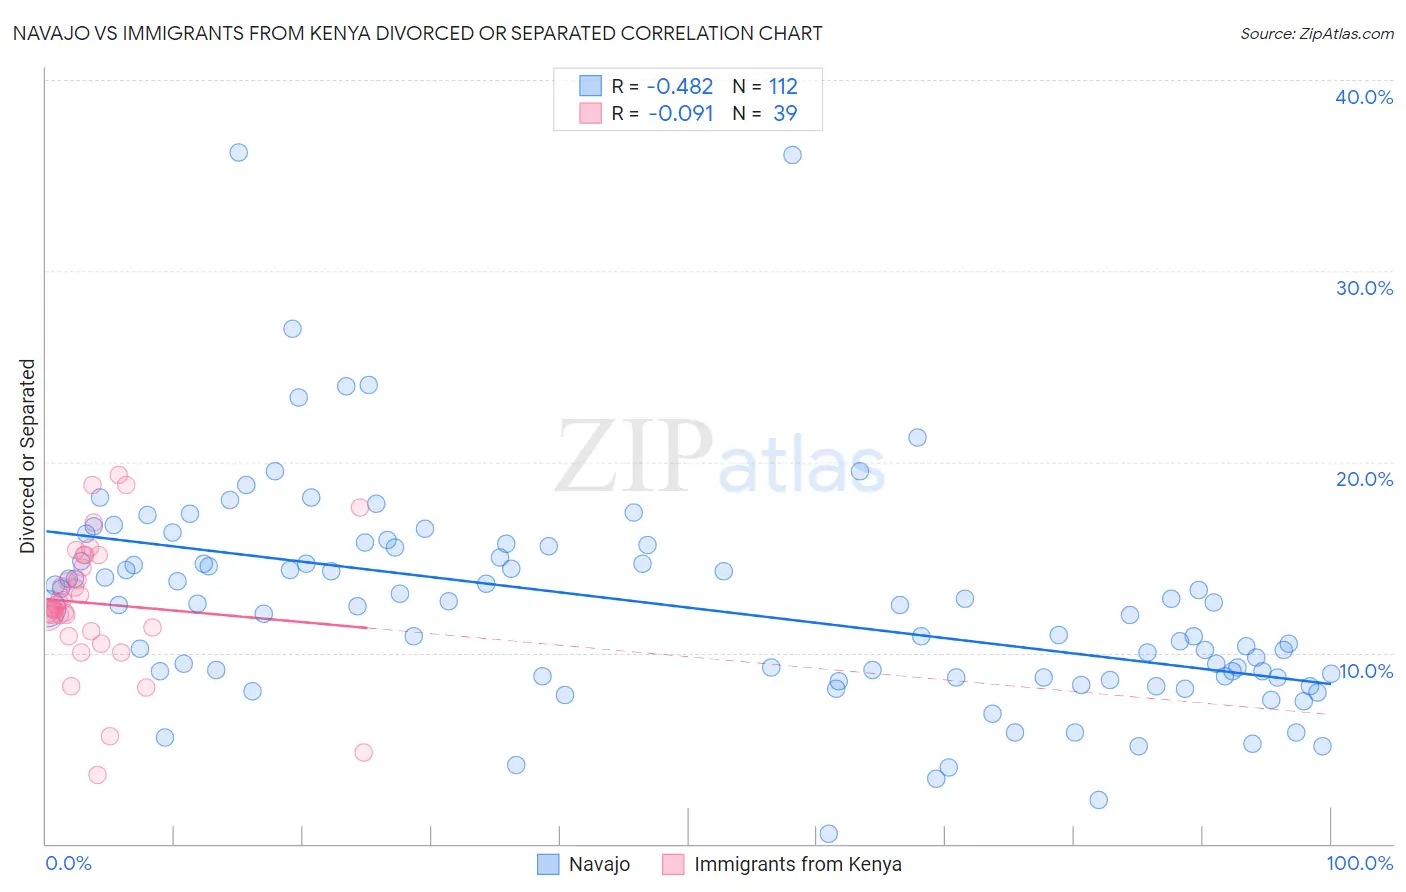
Navajo vs Immigrants from Kenya Divorced or Separated Correlation Chart
The statistical analysis conducted on geographies consisting of 224,845,032 people shows a moderate negative correlation between the proportion of Navajo and percentage of population currently divorced or separated in the United States with a correlation coefficient (R) of -0.482 and weighted average of 12.0%. Similarly, the statistical analysis conducted on geographies consisting of 218,023,552 people shows a slight negative correlation between the proportion of Immigrants from Kenya and percentage of population currently divorced or separated in the United States with a correlation coefficient (R) of -0.091 and weighted average of 12.2%, a difference of 1.9%.
Divorced or Separated Correlation Summary
| Measurement | Navajo | Immigrants from Kenya |
| Minimum | 0.50% | 3.6% |
| Maximum | 36.2% | 19.3% |
| Range | 35.7% | 15.7% |
| Mean | 12.5% | 12.6% |
| Median | 12.5% | 12.3% |
| Interquartile 25% (IQ1) | 8.7% | 11.2% |
| Interquartile 75% (IQ3) | 15.2% | 15.1% |
| Interquartile Range (IQR) | 6.5% | 3.9% |
| Standard Deviation (Sample) | 5.7% | 3.5% |
| Standard Deviation (Population) | 5.7% | 3.4% |
Similar Demographics by Divorced or Separated
Demographics Similar to Navajo by Divorced or Separated
In terms of divorced or separated, the demographic groups most similar to Navajo are Samoan (12.0%, a difference of 0.010%), Swiss (12.0%, a difference of 0.010%), Marshallese (12.0%, a difference of 0.030%), Immigrants from Scotland (12.0%, a difference of 0.070%), and Icelander (12.0%, a difference of 0.080%).
| Demographics | Rating | Rank | Divorced or Separated |
| Hungarians | 70.3 /100 | #156 | Good 12.0% |
| Immigrants | Brazil | 68.8 /100 | #157 | Good 12.0% |
| Icelanders | 66.0 /100 | #158 | Good 12.0% |
| Immigrants | Barbados | 66.0 /100 | #159 | Good 12.0% |
| Immigrants | Scotland | 65.8 /100 | #160 | Good 12.0% |
| Marshallese | 64.6 /100 | #161 | Good 12.0% |
| Samoans | 64.3 /100 | #162 | Good 12.0% |
| Navajo | 63.9 /100 | #163 | Good 12.0% |
| Swiss | 63.6 /100 | #164 | Good 12.0% |
| German Russians | 61.8 /100 | #165 | Good 12.0% |
| Tohono O'odham | 60.4 /100 | #166 | Good 12.0% |
| Ethiopians | 58.5 /100 | #167 | Average 12.0% |
| Serbians | 57.1 /100 | #168 | Average 12.0% |
| Immigrants | Peru | 57.0 /100 | #169 | Average 12.0% |
| Mexican American Indians | 55.8 /100 | #170 | Average 12.0% |
Demographics Similar to Immigrants from Kenya by Divorced or Separated
In terms of divorced or separated, the demographic groups most similar to Immigrants from Kenya are Trinidadian and Tobagonian (12.2%, a difference of 0.010%), Immigrants from Eastern Africa (12.2%, a difference of 0.020%), Slavic (12.2%, a difference of 0.030%), Immigrants from Argentina (12.2%, a difference of 0.060%), and European (12.2%, a difference of 0.070%).
| Demographics | Rating | Rank | Divorced or Separated |
| Immigrants | Costa Rica | 21.3 /100 | #205 | Fair 12.2% |
| Slovaks | 21.0 /100 | #206 | Fair 12.2% |
| Mexicans | 21.0 /100 | #207 | Fair 12.2% |
| Immigrants | Ghana | 18.8 /100 | #208 | Poor 12.2% |
| Immigrants | Trinidad and Tobago | 17.8 /100 | #209 | Poor 12.2% |
| Slavs | 17.0 /100 | #210 | Poor 12.2% |
| Trinidadians and Tobagonians | 16.6 /100 | #211 | Poor 12.2% |
| Immigrants | Kenya | 16.5 /100 | #212 | Poor 12.2% |
| Immigrants | Eastern Africa | 16.2 /100 | #213 | Poor 12.2% |
| Immigrants | Argentina | 15.5 /100 | #214 | Poor 12.2% |
| Europeans | 15.4 /100 | #215 | Poor 12.2% |
| Immigrants | South America | 15.4 /100 | #216 | Poor 12.2% |
| Northern Europeans | 14.7 /100 | #217 | Poor 12.2% |
| Slovenes | 13.2 /100 | #218 | Poor 12.3% |
| Czechoslovakians | 11.7 /100 | #219 | Poor 12.3% |