Honduran vs Immigrants from Kenya Divorced or Separated
COMPARE
Honduran
Immigrants from Kenya
Divorced or Separated
Divorced or Separated Comparison
Hondurans
Immigrants from Kenya
12.8%
DIVORCED OR SEPARATED
0.1/ 100
METRIC RATING
287th/ 347
METRIC RANK
12.2%
DIVORCED OR SEPARATED
16.5/ 100
METRIC RATING
212th/ 347
METRIC RANK
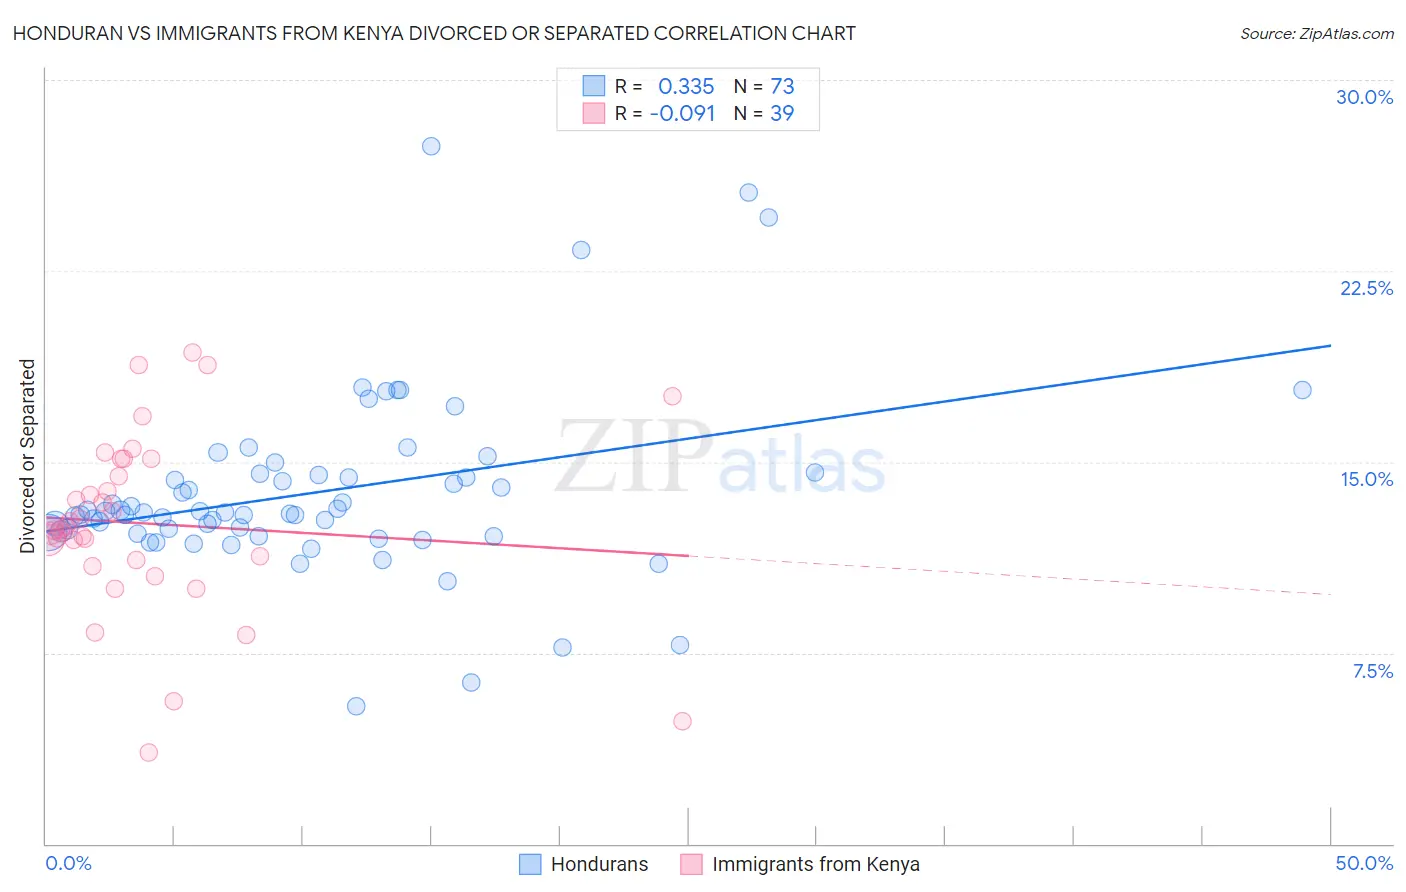
Honduran vs Immigrants from Kenya Divorced or Separated Correlation Chart
The statistical analysis conducted on geographies consisting of 357,724,421 people shows a mild positive correlation between the proportion of Hondurans and percentage of population currently divorced or separated in the United States with a correlation coefficient (R) of 0.335 and weighted average of 12.8%. Similarly, the statistical analysis conducted on geographies consisting of 218,023,552 people shows a slight negative correlation between the proportion of Immigrants from Kenya and percentage of population currently divorced or separated in the United States with a correlation coefficient (R) of -0.091 and weighted average of 12.2%, a difference of 4.8%.
Divorced or Separated Correlation Summary
| Measurement | Honduran | Immigrants from Kenya |
| Minimum | 5.4% | 3.6% |
| Maximum | 27.4% | 19.3% |
| Range | 22.0% | 15.7% |
| Mean | 13.8% | 12.6% |
| Median | 13.0% | 12.3% |
| Interquartile 25% (IQ1) | 12.2% | 11.2% |
| Interquartile 75% (IQ3) | 14.5% | 15.1% |
| Interquartile Range (IQR) | 2.3% | 3.9% |
| Standard Deviation (Sample) | 3.6% | 3.5% |
| Standard Deviation (Population) | 3.6% | 3.4% |
Similar Demographics by Divorced or Separated
Demographics Similar to Hondurans by Divorced or Separated
In terms of divorced or separated, the demographic groups most similar to Hondurans are Spanish (12.8%, a difference of 0.19%), French Canadian (12.8%, a difference of 0.26%), French (12.8%, a difference of 0.41%), Iroquois (12.9%, a difference of 0.41%), and Nonimmigrants (12.8%, a difference of 0.45%).
| Demographics | Rating | Rank | Divorced or Separated |
| Immigrants | Zaire | 0.2 /100 | #280 | Tragic 12.7% |
| Pueblo | 0.2 /100 | #281 | Tragic 12.7% |
| Sub-Saharan Africans | 0.1 /100 | #282 | Tragic 12.7% |
| Delaware | 0.1 /100 | #283 | Tragic 12.7% |
| Immigrants | Nonimmigrants | 0.1 /100 | #284 | Tragic 12.8% |
| French | 0.1 /100 | #285 | Tragic 12.8% |
| Spanish | 0.1 /100 | #286 | Tragic 12.8% |
| Hondurans | 0.1 /100 | #287 | Tragic 12.8% |
| French Canadians | 0.1 /100 | #288 | Tragic 12.8% |
| Iroquois | 0.0 /100 | #289 | Tragic 12.9% |
| Pima | 0.0 /100 | #290 | Tragic 12.9% |
| Immigrants | Honduras | 0.0 /100 | #291 | Tragic 12.9% |
| Scotch-Irish | 0.0 /100 | #292 | Tragic 12.9% |
| Jamaicans | 0.0 /100 | #293 | Tragic 12.9% |
| Apache | 0.0 /100 | #294 | Tragic 12.9% |
Demographics Similar to Immigrants from Kenya by Divorced or Separated
In terms of divorced or separated, the demographic groups most similar to Immigrants from Kenya are Trinidadian and Tobagonian (12.2%, a difference of 0.010%), Immigrants from Eastern Africa (12.2%, a difference of 0.020%), Slavic (12.2%, a difference of 0.030%), Immigrants from Argentina (12.2%, a difference of 0.060%), and European (12.2%, a difference of 0.070%).
| Demographics | Rating | Rank | Divorced or Separated |
| Immigrants | Costa Rica | 21.3 /100 | #205 | Fair 12.2% |
| Slovaks | 21.0 /100 | #206 | Fair 12.2% |
| Mexicans | 21.0 /100 | #207 | Fair 12.2% |
| Immigrants | Ghana | 18.8 /100 | #208 | Poor 12.2% |
| Immigrants | Trinidad and Tobago | 17.8 /100 | #209 | Poor 12.2% |
| Slavs | 17.0 /100 | #210 | Poor 12.2% |
| Trinidadians and Tobagonians | 16.6 /100 | #211 | Poor 12.2% |
| Immigrants | Kenya | 16.5 /100 | #212 | Poor 12.2% |
| Immigrants | Eastern Africa | 16.2 /100 | #213 | Poor 12.2% |
| Immigrants | Argentina | 15.5 /100 | #214 | Poor 12.2% |
| Europeans | 15.4 /100 | #215 | Poor 12.2% |
| Immigrants | South America | 15.4 /100 | #216 | Poor 12.2% |
| Northern Europeans | 14.7 /100 | #217 | Poor 12.2% |
| Slovenes | 13.2 /100 | #218 | Poor 12.3% |
| Czechoslovakians | 11.7 /100 | #219 | Poor 12.3% |