Immigrants from Panama vs Immigrants from Kenya Divorced or Separated
COMPARE
Immigrants from Panama
Immigrants from Kenya
Divorced or Separated
Divorced or Separated Comparison
Immigrants from Panama
Immigrants from Kenya
12.6%
DIVORCED OR SEPARATED
0.5/ 100
METRIC RATING
263rd/ 347
METRIC RANK
12.2%
DIVORCED OR SEPARATED
16.5/ 100
METRIC RATING
212th/ 347
METRIC RANK
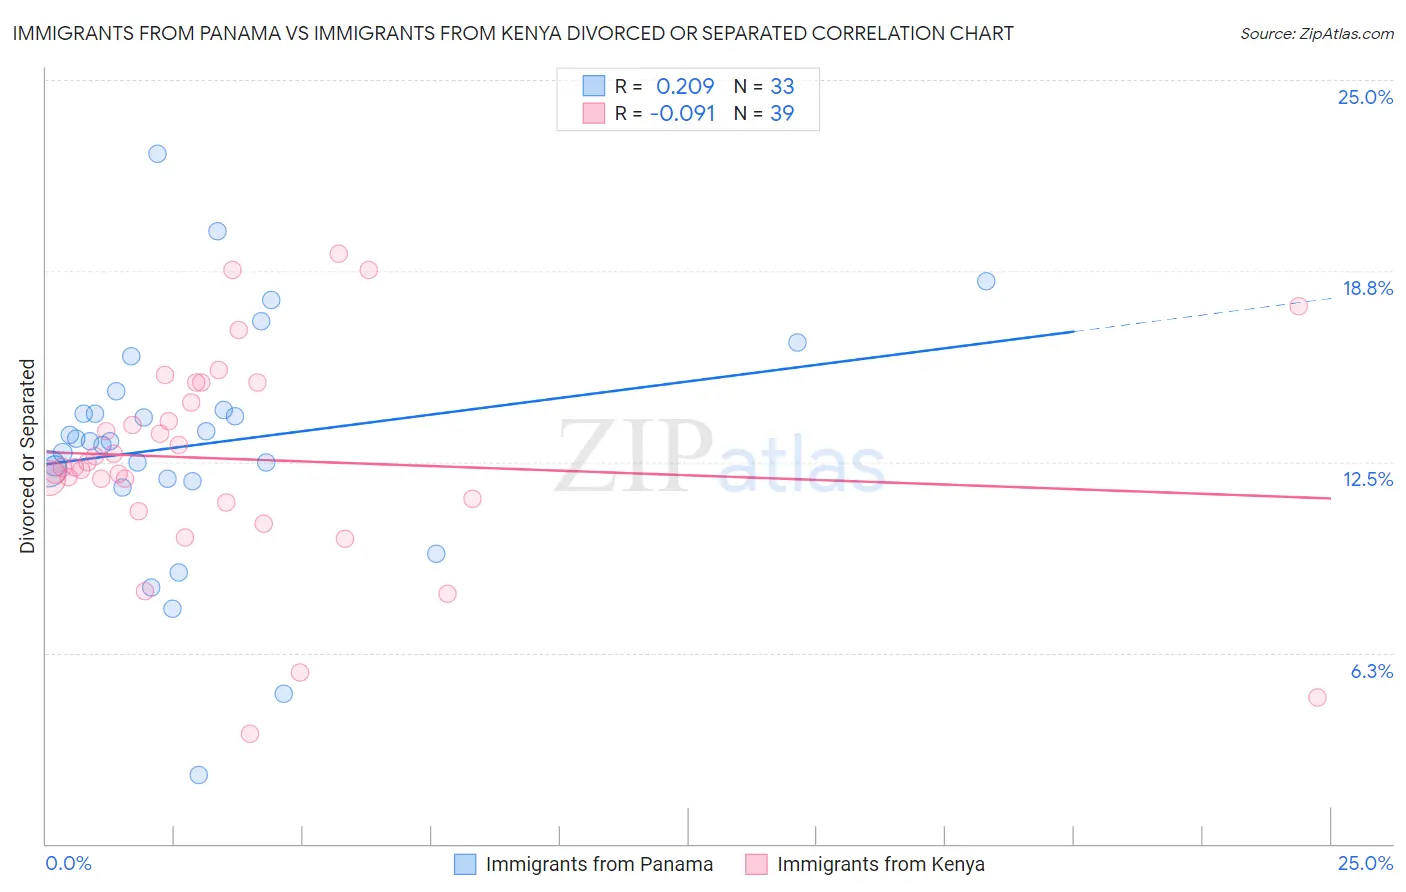
Immigrants from Panama vs Immigrants from Kenya Divorced or Separated Correlation Chart
The statistical analysis conducted on geographies consisting of 221,177,980 people shows a weak positive correlation between the proportion of Immigrants from Panama and percentage of population currently divorced or separated in the United States with a correlation coefficient (R) of 0.209 and weighted average of 12.6%. Similarly, the statistical analysis conducted on geographies consisting of 218,023,552 people shows a slight negative correlation between the proportion of Immigrants from Kenya and percentage of population currently divorced or separated in the United States with a correlation coefficient (R) of -0.091 and weighted average of 12.2%, a difference of 3.2%.
Divorced or Separated Correlation Summary
| Measurement | Immigrants from Panama | Immigrants from Kenya |
| Minimum | 2.3% | 3.6% |
| Maximum | 22.6% | 19.3% |
| Range | 20.3% | 15.7% |
| Mean | 13.1% | 12.6% |
| Median | 13.2% | 12.3% |
| Interquartile 25% (IQ1) | 11.9% | 11.2% |
| Interquartile 75% (IQ3) | 14.5% | 15.1% |
| Interquartile Range (IQR) | 2.6% | 3.9% |
| Standard Deviation (Sample) | 4.0% | 3.5% |
| Standard Deviation (Population) | 3.9% | 3.4% |
Similar Demographics by Divorced or Separated
Demographics Similar to Immigrants from Panama by Divorced or Separated
In terms of divorced or separated, the demographic groups most similar to Immigrants from Panama are English (12.6%, a difference of 0.020%), Immigrants from Senegal (12.6%, a difference of 0.030%), Basque (12.6%, a difference of 0.050%), White/Caucasian (12.6%, a difference of 0.050%), and Scottish (12.6%, a difference of 0.090%).
| Demographics | Rating | Rank | Divorced or Separated |
| Immigrants | Colombia | 0.6 /100 | #256 | Tragic 12.6% |
| Immigrants | Somalia | 0.6 /100 | #257 | Tragic 12.6% |
| Indonesians | 0.6 /100 | #258 | Tragic 12.6% |
| Yuman | 0.6 /100 | #259 | Tragic 12.6% |
| Immigrants | Uruguay | 0.6 /100 | #260 | Tragic 12.6% |
| Immigrants | Dominica | 0.5 /100 | #261 | Tragic 12.6% |
| Basques | 0.5 /100 | #262 | Tragic 12.6% |
| Immigrants | Panama | 0.5 /100 | #263 | Tragic 12.6% |
| English | 0.5 /100 | #264 | Tragic 12.6% |
| Immigrants | Senegal | 0.5 /100 | #265 | Tragic 12.6% |
| Whites/Caucasians | 0.5 /100 | #266 | Tragic 12.6% |
| Scottish | 0.4 /100 | #267 | Tragic 12.6% |
| Fijians | 0.4 /100 | #268 | Tragic 12.6% |
| Immigrants | Liberia | 0.4 /100 | #269 | Tragic 12.6% |
| Ute | 0.4 /100 | #270 | Tragic 12.6% |
Demographics Similar to Immigrants from Kenya by Divorced or Separated
In terms of divorced or separated, the demographic groups most similar to Immigrants from Kenya are Trinidadian and Tobagonian (12.2%, a difference of 0.010%), Immigrants from Eastern Africa (12.2%, a difference of 0.020%), Slavic (12.2%, a difference of 0.030%), Immigrants from Argentina (12.2%, a difference of 0.060%), and European (12.2%, a difference of 0.070%).
| Demographics | Rating | Rank | Divorced or Separated |
| Immigrants | Costa Rica | 21.3 /100 | #205 | Fair 12.2% |
| Slovaks | 21.0 /100 | #206 | Fair 12.2% |
| Mexicans | 21.0 /100 | #207 | Fair 12.2% |
| Immigrants | Ghana | 18.8 /100 | #208 | Poor 12.2% |
| Immigrants | Trinidad and Tobago | 17.8 /100 | #209 | Poor 12.2% |
| Slavs | 17.0 /100 | #210 | Poor 12.2% |
| Trinidadians and Tobagonians | 16.6 /100 | #211 | Poor 12.2% |
| Immigrants | Kenya | 16.5 /100 | #212 | Poor 12.2% |
| Immigrants | Eastern Africa | 16.2 /100 | #213 | Poor 12.2% |
| Immigrants | Argentina | 15.5 /100 | #214 | Poor 12.2% |
| Europeans | 15.4 /100 | #215 | Poor 12.2% |
| Immigrants | South America | 15.4 /100 | #216 | Poor 12.2% |
| Northern Europeans | 14.7 /100 | #217 | Poor 12.2% |
| Slovenes | 13.2 /100 | #218 | Poor 12.3% |
| Czechoslovakians | 11.7 /100 | #219 | Poor 12.3% |