Navajo vs Comanche Divorced or Separated
COMPARE
Navajo
Comanche
Divorced or Separated
Divorced or Separated Comparison
Navajo
Comanche
12.0%
DIVORCED OR SEPARATED
63.9/ 100
METRIC RATING
163rd/ 347
METRIC RANK
13.5%
DIVORCED OR SEPARATED
0.0/ 100
METRIC RATING
327th/ 347
METRIC RANK
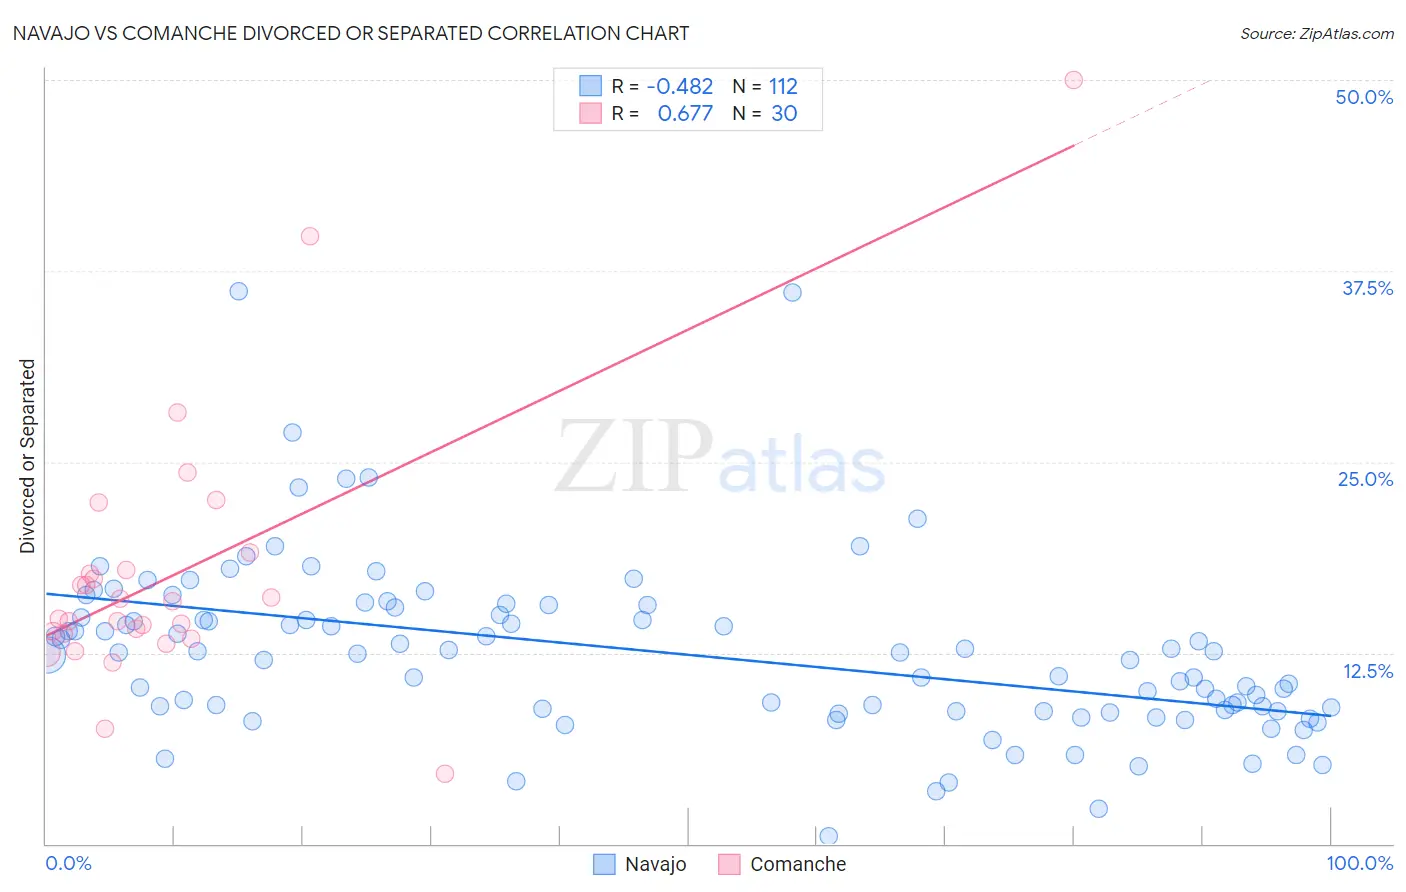
Navajo vs Comanche Divorced or Separated Correlation Chart
The statistical analysis conducted on geographies consisting of 224,845,032 people shows a moderate negative correlation between the proportion of Navajo and percentage of population currently divorced or separated in the United States with a correlation coefficient (R) of -0.482 and weighted average of 12.0%. Similarly, the statistical analysis conducted on geographies consisting of 109,776,107 people shows a significant positive correlation between the proportion of Comanche and percentage of population currently divorced or separated in the United States with a correlation coefficient (R) of 0.677 and weighted average of 13.5%, a difference of 12.7%.
Divorced or Separated Correlation Summary
| Measurement | Navajo | Comanche |
| Minimum | 0.50% | 4.6% |
| Maximum | 36.2% | 50.0% |
| Range | 35.7% | 45.4% |
| Mean | 12.5% | 17.7% |
| Median | 12.5% | 15.3% |
| Interquartile 25% (IQ1) | 8.7% | 13.7% |
| Interquartile 75% (IQ3) | 15.2% | 18.0% |
| Interquartile Range (IQR) | 6.5% | 4.2% |
| Standard Deviation (Sample) | 5.7% | 8.8% |
| Standard Deviation (Population) | 5.7% | 8.6% |
Similar Demographics by Divorced or Separated
Demographics Similar to Navajo by Divorced or Separated
In terms of divorced or separated, the demographic groups most similar to Navajo are Samoan (12.0%, a difference of 0.010%), Swiss (12.0%, a difference of 0.010%), Marshallese (12.0%, a difference of 0.030%), Immigrants from Scotland (12.0%, a difference of 0.070%), and Icelander (12.0%, a difference of 0.080%).
| Demographics | Rating | Rank | Divorced or Separated |
| Hungarians | 70.3 /100 | #156 | Good 12.0% |
| Immigrants | Brazil | 68.8 /100 | #157 | Good 12.0% |
| Icelanders | 66.0 /100 | #158 | Good 12.0% |
| Immigrants | Barbados | 66.0 /100 | #159 | Good 12.0% |
| Immigrants | Scotland | 65.8 /100 | #160 | Good 12.0% |
| Marshallese | 64.6 /100 | #161 | Good 12.0% |
| Samoans | 64.3 /100 | #162 | Good 12.0% |
| Navajo | 63.9 /100 | #163 | Good 12.0% |
| Swiss | 63.6 /100 | #164 | Good 12.0% |
| German Russians | 61.8 /100 | #165 | Good 12.0% |
| Tohono O'odham | 60.4 /100 | #166 | Good 12.0% |
| Ethiopians | 58.5 /100 | #167 | Average 12.0% |
| Serbians | 57.1 /100 | #168 | Average 12.0% |
| Immigrants | Peru | 57.0 /100 | #169 | Average 12.0% |
| Mexican American Indians | 55.8 /100 | #170 | Average 12.0% |
Demographics Similar to Comanche by Divorced or Separated
In terms of divorced or separated, the demographic groups most similar to Comanche are Immigrants from Caribbean (13.6%, a difference of 0.38%), Immigrants from Congo (13.5%, a difference of 0.48%), Potawatomi (13.5%, a difference of 0.49%), Houma (13.6%, a difference of 0.53%), and Osage (13.4%, a difference of 0.55%).
| Demographics | Rating | Rank | Divorced or Separated |
| Cajuns | 0.0 /100 | #320 | Tragic 13.4% |
| Cheyenne | 0.0 /100 | #321 | Tragic 13.4% |
| Immigrants | Haiti | 0.0 /100 | #322 | Tragic 13.4% |
| U.S. Virgin Islanders | 0.0 /100 | #323 | Tragic 13.4% |
| Osage | 0.0 /100 | #324 | Tragic 13.4% |
| Potawatomi | 0.0 /100 | #325 | Tragic 13.5% |
| Immigrants | Congo | 0.0 /100 | #326 | Tragic 13.5% |
| Comanche | 0.0 /100 | #327 | Tragic 13.5% |
| Immigrants | Caribbean | 0.0 /100 | #328 | Tragic 13.6% |
| Houma | 0.0 /100 | #329 | Tragic 13.6% |
| Paiute | 0.0 /100 | #330 | Tragic 13.6% |
| Blacks/African Americans | 0.0 /100 | #331 | Tragic 13.6% |
| Cherokee | 0.0 /100 | #332 | Tragic 13.7% |
| Puerto Ricans | 0.0 /100 | #333 | Tragic 13.9% |
| Immigrants | Bahamas | 0.0 /100 | #334 | Tragic 13.9% |