Cree vs Immigrants from Kenya Divorced or Separated
COMPARE
Cree
Immigrants from Kenya
Divorced or Separated
Divorced or Separated Comparison
Cree
Immigrants from Kenya
13.4%
DIVORCED OR SEPARATED
0.0/ 100
METRIC RATING
318th/ 347
METRIC RANK
12.2%
DIVORCED OR SEPARATED
16.5/ 100
METRIC RATING
212th/ 347
METRIC RANK
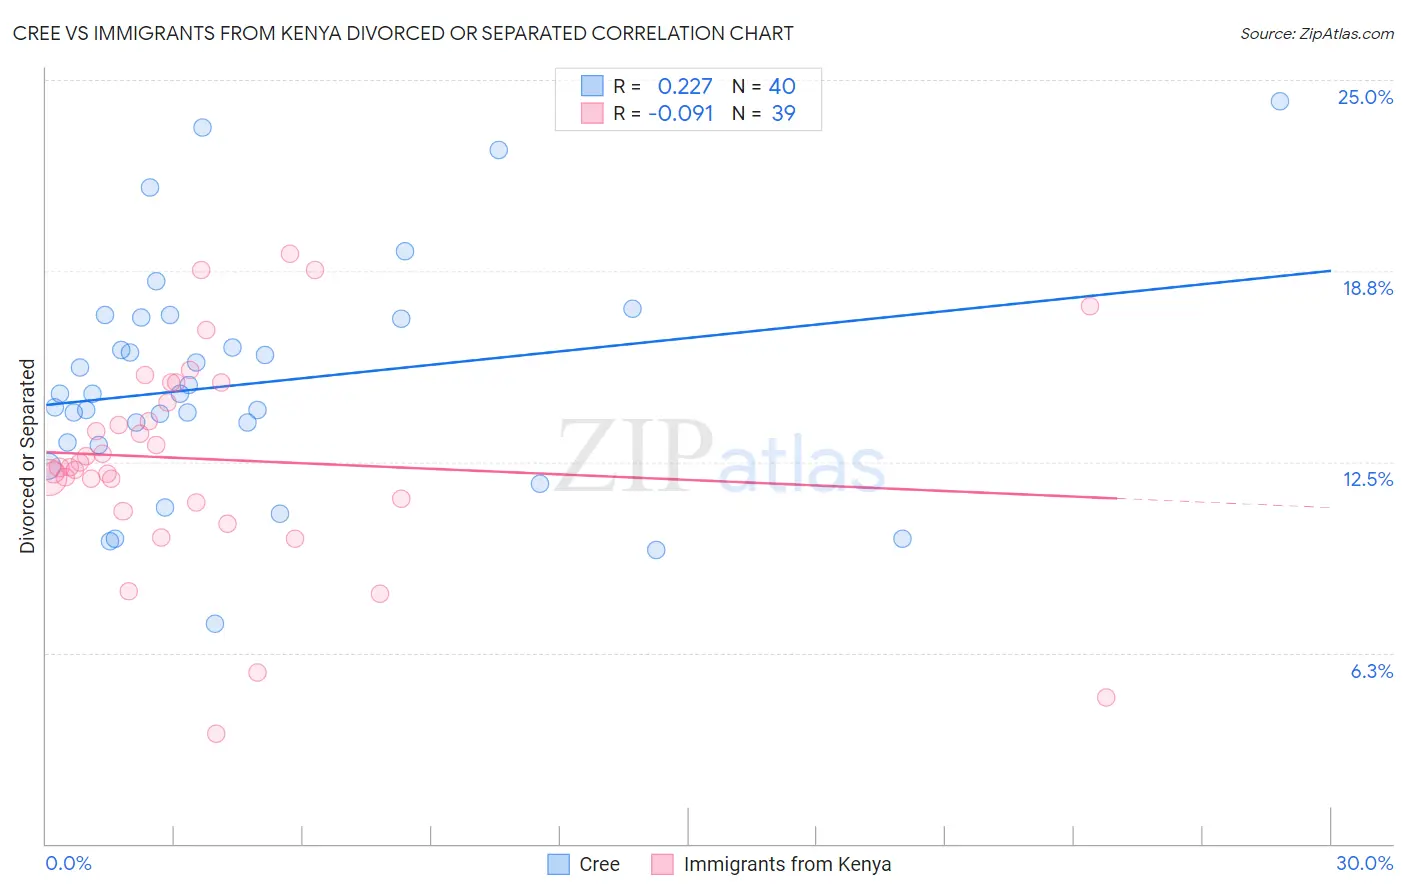
Cree vs Immigrants from Kenya Divorced or Separated Correlation Chart
The statistical analysis conducted on geographies consisting of 76,211,532 people shows a weak positive correlation between the proportion of Cree and percentage of population currently divorced or separated in the United States with a correlation coefficient (R) of 0.227 and weighted average of 13.4%. Similarly, the statistical analysis conducted on geographies consisting of 218,023,552 people shows a slight negative correlation between the proportion of Immigrants from Kenya and percentage of population currently divorced or separated in the United States with a correlation coefficient (R) of -0.091 and weighted average of 12.2%, a difference of 9.2%.
Divorced or Separated Correlation Summary
| Measurement | Cree | Immigrants from Kenya |
| Minimum | 7.2% | 3.6% |
| Maximum | 24.3% | 19.3% |
| Range | 17.1% | 15.7% |
| Mean | 15.1% | 12.6% |
| Median | 14.7% | 12.3% |
| Interquartile 25% (IQ1) | 13.1% | 11.2% |
| Interquartile 75% (IQ3) | 17.2% | 15.1% |
| Interquartile Range (IQR) | 4.1% | 3.9% |
| Standard Deviation (Sample) | 3.8% | 3.5% |
| Standard Deviation (Population) | 3.7% | 3.4% |
Similar Demographics by Divorced or Separated
Demographics Similar to Cree by Divorced or Separated
In terms of divorced or separated, the demographic groups most similar to Cree are Haitian (13.3%, a difference of 0.030%), Puget Sound Salish (13.4%, a difference of 0.040%), Tsimshian (13.3%, a difference of 0.050%), Spanish American (13.3%, a difference of 0.080%), and Cajun (13.4%, a difference of 0.10%).
| Demographics | Rating | Rank | Divorced or Separated |
| Sioux | 0.0 /100 | #311 | Tragic 13.2% |
| Blackfeet | 0.0 /100 | #312 | Tragic 13.3% |
| Immigrants | Nicaragua | 0.0 /100 | #313 | Tragic 13.3% |
| Yaqui | 0.0 /100 | #314 | Tragic 13.3% |
| Spanish Americans | 0.0 /100 | #315 | Tragic 13.3% |
| Tsimshian | 0.0 /100 | #316 | Tragic 13.3% |
| Haitians | 0.0 /100 | #317 | Tragic 13.3% |
| Cree | 0.0 /100 | #318 | Tragic 13.4% |
| Puget Sound Salish | 0.0 /100 | #319 | Tragic 13.4% |
| Cajuns | 0.0 /100 | #320 | Tragic 13.4% |
| Cheyenne | 0.0 /100 | #321 | Tragic 13.4% |
| Immigrants | Haiti | 0.0 /100 | #322 | Tragic 13.4% |
| U.S. Virgin Islanders | 0.0 /100 | #323 | Tragic 13.4% |
| Osage | 0.0 /100 | #324 | Tragic 13.4% |
| Potawatomi | 0.0 /100 | #325 | Tragic 13.5% |
Demographics Similar to Immigrants from Kenya by Divorced or Separated
In terms of divorced or separated, the demographic groups most similar to Immigrants from Kenya are Trinidadian and Tobagonian (12.2%, a difference of 0.010%), Immigrants from Eastern Africa (12.2%, a difference of 0.020%), Slavic (12.2%, a difference of 0.030%), Immigrants from Argentina (12.2%, a difference of 0.060%), and European (12.2%, a difference of 0.070%).
| Demographics | Rating | Rank | Divorced or Separated |
| Immigrants | Costa Rica | 21.3 /100 | #205 | Fair 12.2% |
| Slovaks | 21.0 /100 | #206 | Fair 12.2% |
| Mexicans | 21.0 /100 | #207 | Fair 12.2% |
| Immigrants | Ghana | 18.8 /100 | #208 | Poor 12.2% |
| Immigrants | Trinidad and Tobago | 17.8 /100 | #209 | Poor 12.2% |
| Slavs | 17.0 /100 | #210 | Poor 12.2% |
| Trinidadians and Tobagonians | 16.6 /100 | #211 | Poor 12.2% |
| Immigrants | Kenya | 16.5 /100 | #212 | Poor 12.2% |
| Immigrants | Eastern Africa | 16.2 /100 | #213 | Poor 12.2% |
| Immigrants | Argentina | 15.5 /100 | #214 | Poor 12.2% |
| Europeans | 15.4 /100 | #215 | Poor 12.2% |
| Immigrants | South America | 15.4 /100 | #216 | Poor 12.2% |
| Northern Europeans | 14.7 /100 | #217 | Poor 12.2% |
| Slovenes | 13.2 /100 | #218 | Poor 12.3% |
| Czechoslovakians | 11.7 /100 | #219 | Poor 12.3% |