Navajo vs Immigrants from Kenya No Vehicles in Household
COMPARE
Navajo
Immigrants from Kenya
No Vehicles in Household
No Vehicles in Household Comparison
Navajo
Immigrants from Kenya
9.4%
NO VEHICLES IN HOUSEHOLD
94.2/ 100
METRIC RATING
115th/ 347
METRIC RANK
9.6%
NO VEHICLES IN HOUSEHOLD
89.7/ 100
METRIC RATING
127th/ 347
METRIC RANK
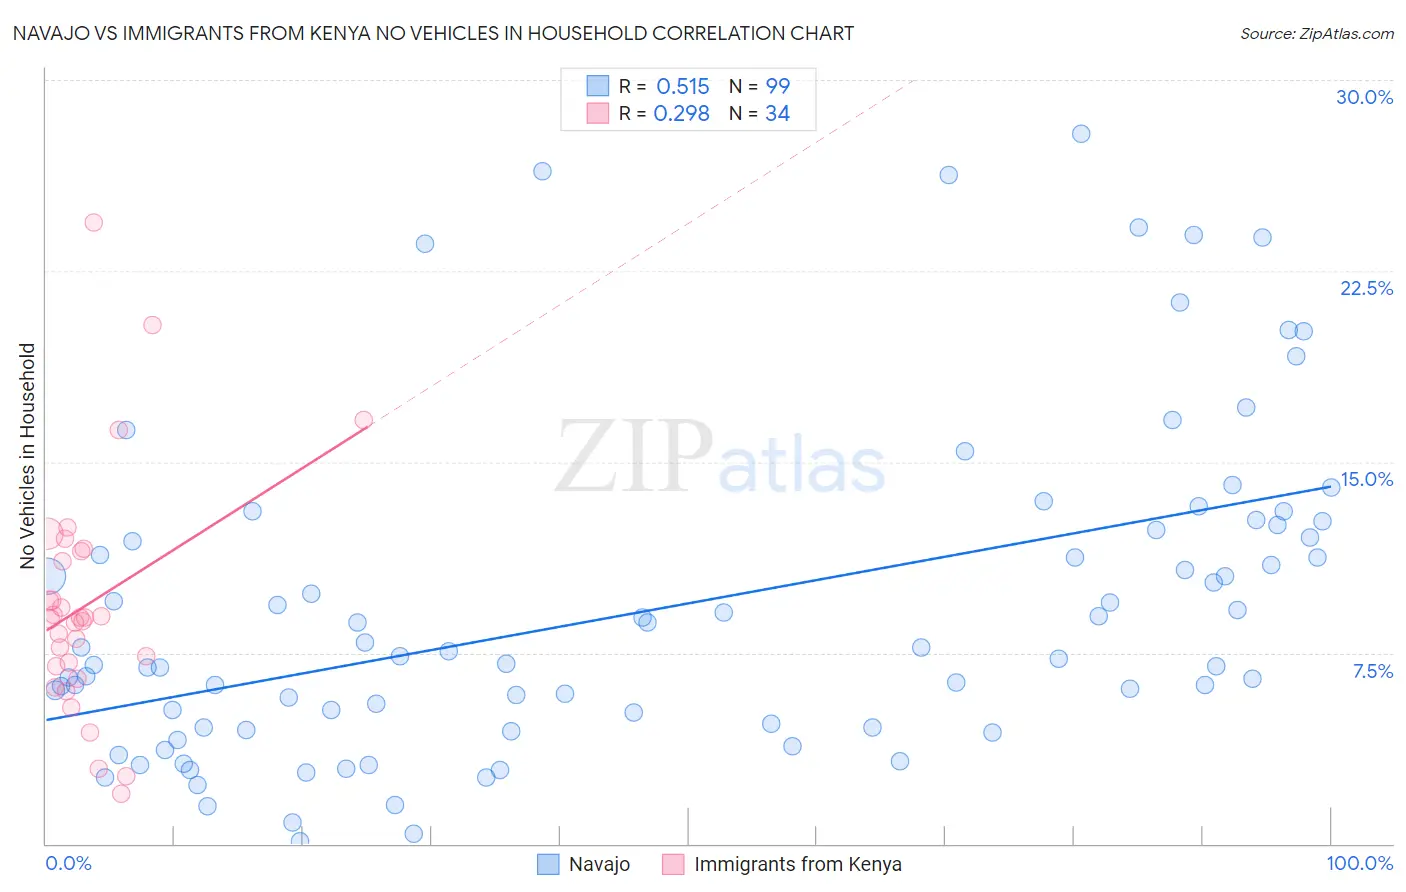
Navajo vs Immigrants from Kenya No Vehicles in Household Correlation Chart
The statistical analysis conducted on geographies consisting of 224,409,454 people shows a substantial positive correlation between the proportion of Navajo and percentage of households with no vehicle available in the United States with a correlation coefficient (R) of 0.515 and weighted average of 9.4%. Similarly, the statistical analysis conducted on geographies consisting of 217,879,902 people shows a weak positive correlation between the proportion of Immigrants from Kenya and percentage of households with no vehicle available in the United States with a correlation coefficient (R) of 0.298 and weighted average of 9.6%, a difference of 2.3%.
No Vehicles in Household Correlation Summary
| Measurement | Navajo | Immigrants from Kenya |
| Minimum | 0.12% | 2.0% |
| Maximum | 27.9% | 24.4% |
| Range | 27.8% | 22.4% |
| Mean | 9.3% | 9.4% |
| Median | 7.4% | 8.9% |
| Interquartile 25% (IQ1) | 4.6% | 7.0% |
| Interquartile 75% (IQ3) | 12.3% | 11.5% |
| Interquartile Range (IQR) | 7.8% | 4.5% |
| Standard Deviation (Sample) | 6.3% | 4.7% |
| Standard Deviation (Population) | 6.3% | 4.6% |
Demographics Similar to Navajo and Immigrants from Kenya by No Vehicles in Household
In terms of no vehicles in household, the demographic groups most similar to Navajo are Serbian (9.4%, a difference of 0.070%), Japanese (9.4%, a difference of 0.070%), Chippewa (9.4%, a difference of 0.24%), Immigrants from Netherlands (9.4%, a difference of 0.49%), and Armenian (9.4%, a difference of 0.59%). Similarly, the demographic groups most similar to Immigrants from Kenya are Immigrants from Syria (9.6%, a difference of 0.080%), Nicaraguan (9.7%, a difference of 0.11%), Icelander (9.6%, a difference of 0.18%), Immigrants from Cameroon (9.6%, a difference of 0.35%), and Burmese (9.7%, a difference of 0.36%).
| Demographics | Rating | Rank | No Vehicles in Household |
| Immigrants | Kuwait | 95.1 /100 | #111 | Exceptional 9.4% |
| Armenians | 95.0 /100 | #112 | Exceptional 9.4% |
| Immigrants | Netherlands | 94.8 /100 | #113 | Exceptional 9.4% |
| Serbians | 94.3 /100 | #114 | Exceptional 9.4% |
| Navajo | 94.2 /100 | #115 | Exceptional 9.4% |
| Japanese | 94.1 /100 | #116 | Exceptional 9.4% |
| Chippewa | 93.8 /100 | #117 | Exceptional 9.4% |
| Greeks | 92.9 /100 | #118 | Exceptional 9.5% |
| Fijians | 92.7 /100 | #119 | Exceptional 9.5% |
| Immigrants | Thailand | 92.6 /100 | #120 | Exceptional 9.5% |
| Puget Sound Salish | 92.4 /100 | #121 | Exceptional 9.5% |
| Costa Ricans | 92.3 /100 | #122 | Exceptional 9.5% |
| Blackfeet | 91.4 /100 | #123 | Exceptional 9.6% |
| Immigrants | Korea | 90.9 /100 | #124 | Exceptional 9.6% |
| Immigrants | Cameroon | 90.6 /100 | #125 | Exceptional 9.6% |
| Icelanders | 90.2 /100 | #126 | Exceptional 9.6% |
| Immigrants | Kenya | 89.7 /100 | #127 | Excellent 9.6% |
| Immigrants | Syria | 89.5 /100 | #128 | Excellent 9.6% |
| Nicaraguans | 89.5 /100 | #129 | Excellent 9.7% |
| Burmese | 88.8 /100 | #130 | Excellent 9.7% |
| Immigrants | Azores | 88.2 /100 | #131 | Excellent 9.7% |