Navajo vs Immigrants from Japan Divorced or Separated
COMPARE
Navajo
Immigrants from Japan
Divorced or Separated
Divorced or Separated Comparison
Navajo
Immigrants from Japan
12.0%
DIVORCED OR SEPARATED
63.9/ 100
METRIC RATING
163rd/ 347
METRIC RANK
11.1%
DIVORCED OR SEPARATED
100.0/ 100
METRIC RATING
36th/ 347
METRIC RANK
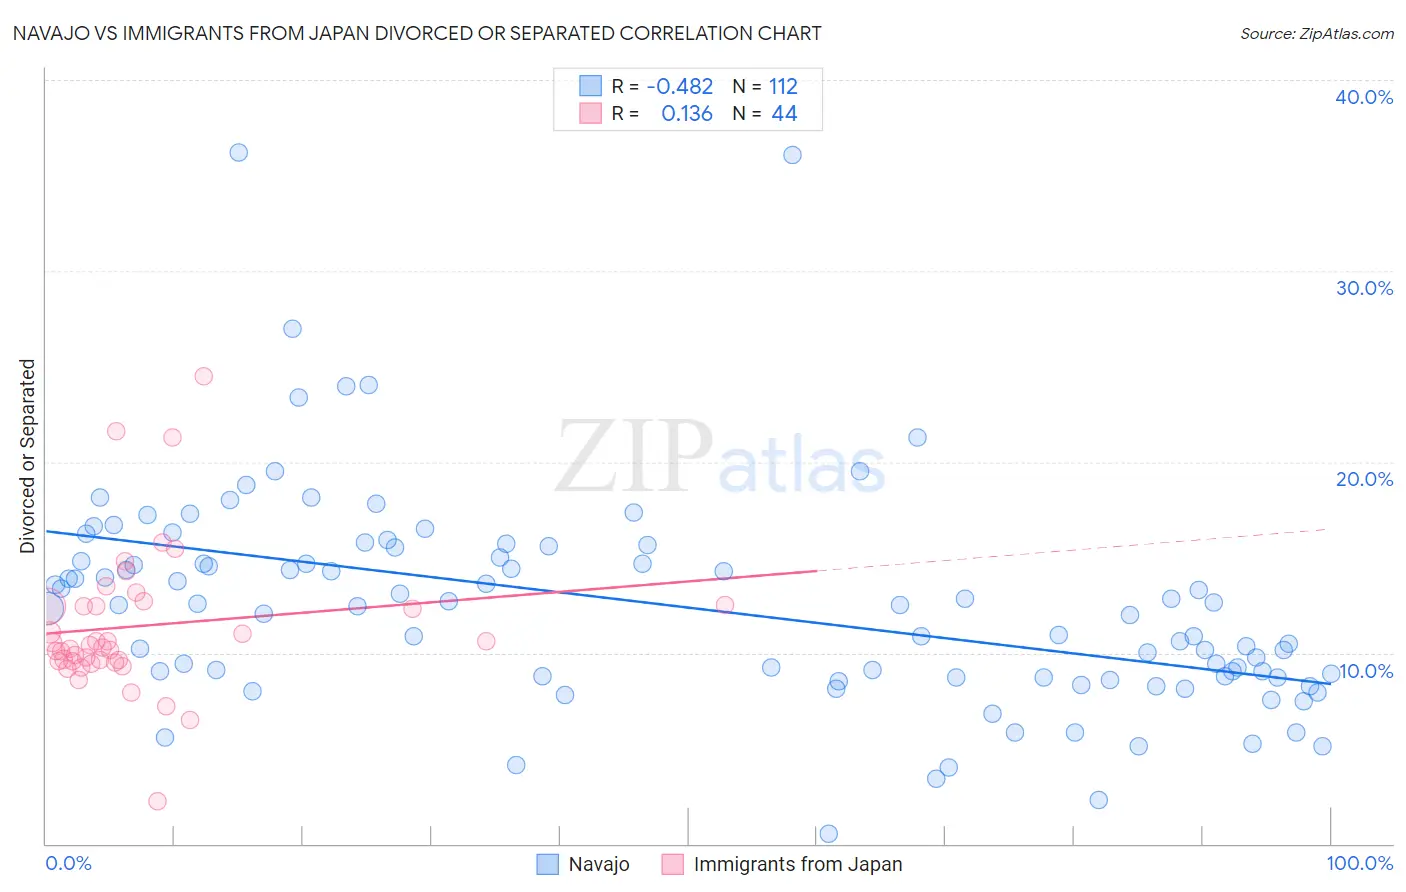
Navajo vs Immigrants from Japan Divorced or Separated Correlation Chart
The statistical analysis conducted on geographies consisting of 224,845,032 people shows a moderate negative correlation between the proportion of Navajo and percentage of population currently divorced or separated in the United States with a correlation coefficient (R) of -0.482 and weighted average of 12.0%. Similarly, the statistical analysis conducted on geographies consisting of 340,021,973 people shows a poor positive correlation between the proportion of Immigrants from Japan and percentage of population currently divorced or separated in the United States with a correlation coefficient (R) of 0.136 and weighted average of 11.1%, a difference of 8.1%.
Divorced or Separated Correlation Summary
| Measurement | Navajo | Immigrants from Japan |
| Minimum | 0.50% | 2.2% |
| Maximum | 36.2% | 24.5% |
| Range | 35.7% | 22.3% |
| Mean | 12.5% | 11.4% |
| Median | 12.5% | 10.4% |
| Interquartile 25% (IQ1) | 8.7% | 9.6% |
| Interquartile 75% (IQ3) | 15.2% | 12.5% |
| Interquartile Range (IQR) | 6.5% | 2.9% |
| Standard Deviation (Sample) | 5.7% | 3.9% |
| Standard Deviation (Population) | 5.7% | 3.8% |
Similar Demographics by Divorced or Separated
Demographics Similar to Navajo by Divorced or Separated
In terms of divorced or separated, the demographic groups most similar to Navajo are Samoan (12.0%, a difference of 0.010%), Swiss (12.0%, a difference of 0.010%), Marshallese (12.0%, a difference of 0.030%), Immigrants from Scotland (12.0%, a difference of 0.070%), and Icelander (12.0%, a difference of 0.080%).
| Demographics | Rating | Rank | Divorced or Separated |
| Hungarians | 70.3 /100 | #156 | Good 12.0% |
| Immigrants | Brazil | 68.8 /100 | #157 | Good 12.0% |
| Icelanders | 66.0 /100 | #158 | Good 12.0% |
| Immigrants | Barbados | 66.0 /100 | #159 | Good 12.0% |
| Immigrants | Scotland | 65.8 /100 | #160 | Good 12.0% |
| Marshallese | 64.6 /100 | #161 | Good 12.0% |
| Samoans | 64.3 /100 | #162 | Good 12.0% |
| Navajo | 63.9 /100 | #163 | Good 12.0% |
| Swiss | 63.6 /100 | #164 | Good 12.0% |
| German Russians | 61.8 /100 | #165 | Good 12.0% |
| Tohono O'odham | 60.4 /100 | #166 | Good 12.0% |
| Ethiopians | 58.5 /100 | #167 | Average 12.0% |
| Serbians | 57.1 /100 | #168 | Average 12.0% |
| Immigrants | Peru | 57.0 /100 | #169 | Average 12.0% |
| Mexican American Indians | 55.8 /100 | #170 | Average 12.0% |
Demographics Similar to Immigrants from Japan by Divorced or Separated
In terms of divorced or separated, the demographic groups most similar to Immigrants from Japan are Immigrants from Lebanon (11.1%, a difference of 0.010%), Cambodian (11.1%, a difference of 0.060%), Immigrants from Greece (11.1%, a difference of 0.070%), Immigrants from Uzbekistan (11.1%, a difference of 0.14%), and Egyptian (11.1%, a difference of 0.21%).
| Demographics | Rating | Rank | Divorced or Separated |
| Armenians | 100.0 /100 | #29 | Exceptional 11.0% |
| Immigrants | Ireland | 100.0 /100 | #30 | Exceptional 11.0% |
| Mongolians | 100.0 /100 | #31 | Exceptional 11.1% |
| Tongans | 100.0 /100 | #32 | Exceptional 11.1% |
| Egyptians | 100.0 /100 | #33 | Exceptional 11.1% |
| Immigrants | Uzbekistan | 100.0 /100 | #34 | Exceptional 11.1% |
| Cambodians | 100.0 /100 | #35 | Exceptional 11.1% |
| Immigrants | Japan | 100.0 /100 | #36 | Exceptional 11.1% |
| Immigrants | Lebanon | 100.0 /100 | #37 | Exceptional 11.1% |
| Immigrants | Greece | 100.0 /100 | #38 | Exceptional 11.1% |
| Immigrants | Egypt | 100.0 /100 | #39 | Exceptional 11.1% |
| Soviet Union | 100.0 /100 | #40 | Exceptional 11.1% |
| Bhutanese | 100.0 /100 | #41 | Exceptional 11.2% |
| Chinese | 100.0 /100 | #42 | Exceptional 11.2% |
| Immigrants | Belarus | 100.0 /100 | #43 | Exceptional 11.2% |