Native/Alaskan vs Zimbabwean Unemployment Among Ages 16 to 19 years
COMPARE
Native/Alaskan
Zimbabwean
Unemployment Among Ages 16 to 19 years
Unemployment Among Ages 16 to 19 years Comparison
Natives/Alaskans
Zimbabweans
21.5%
UNEMPLOYMENT AMONG AGES 16 TO 19 YEARS
0.0/ 100
METRIC RATING
309th/ 347
METRIC RANK
15.4%
UNEMPLOYMENT AMONG AGES 16 TO 19 YEARS
100.0/ 100
METRIC RATING
10th/ 347
METRIC RANK
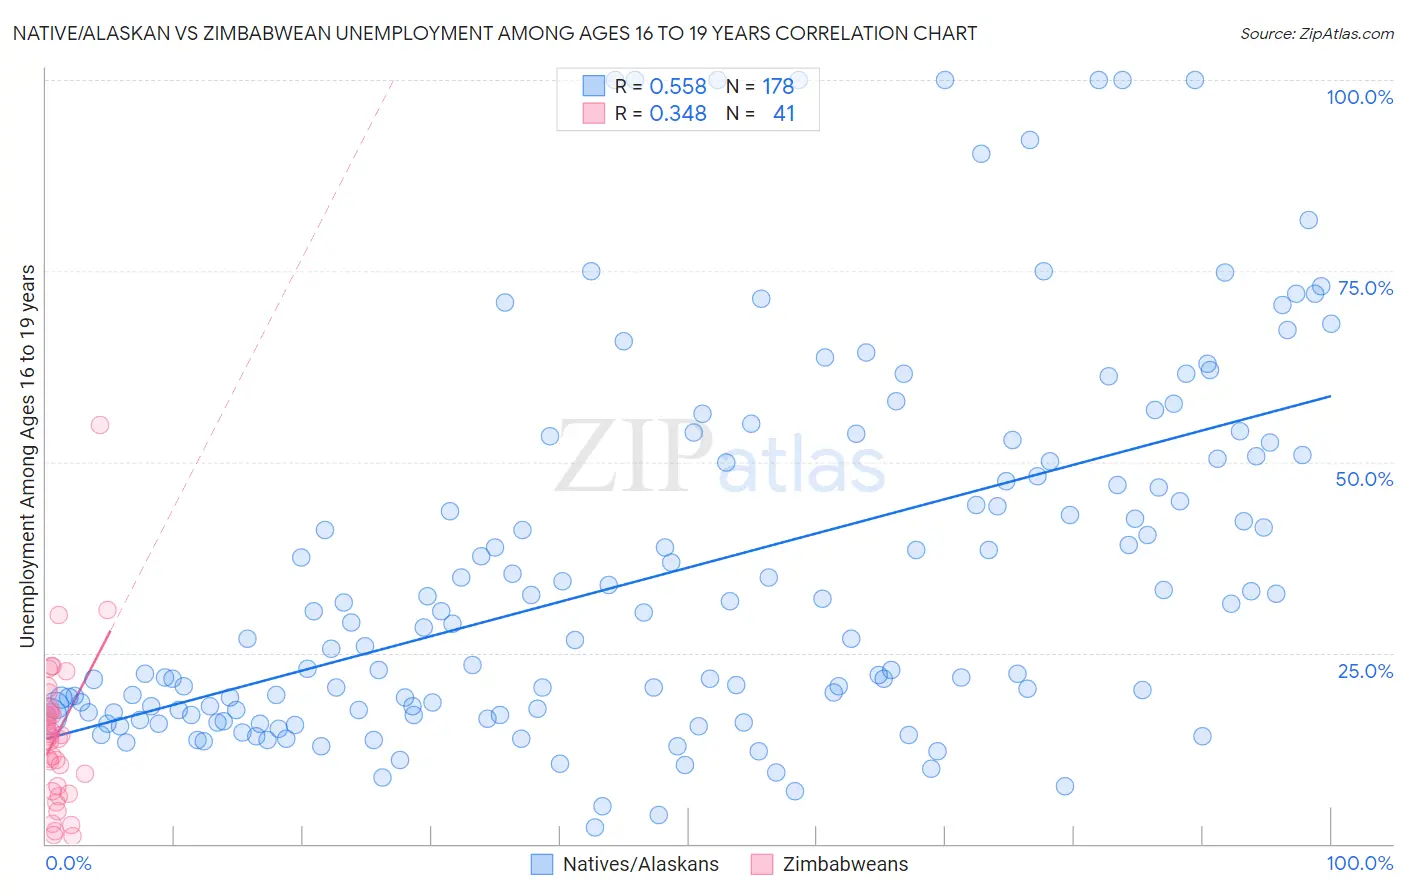
Native/Alaskan vs Zimbabwean Unemployment Among Ages 16 to 19 years Correlation Chart
The statistical analysis conducted on geographies consisting of 472,983,202 people shows a substantial positive correlation between the proportion of Natives/Alaskans and unemployment rate among population between the ages 16 and 19 in the United States with a correlation coefficient (R) of 0.558 and weighted average of 21.5%. Similarly, the statistical analysis conducted on geographies consisting of 68,440,311 people shows a mild positive correlation between the proportion of Zimbabweans and unemployment rate among population between the ages 16 and 19 in the United States with a correlation coefficient (R) of 0.348 and weighted average of 15.4%, a difference of 39.3%.
Unemployment Among Ages 16 to 19 years Correlation Summary
| Measurement | Native/Alaskan | Zimbabwean |
| Minimum | 2.2% | 1.0% |
| Maximum | 100.0% | 54.9% |
| Range | 97.8% | 53.9% |
| Mean | 35.5% | 14.4% |
| Median | 27.6% | 14.0% |
| Interquartile 25% (IQ1) | 17.3% | 7.2% |
| Interquartile 75% (IQ3) | 50.2% | 17.6% |
| Interquartile Range (IQR) | 32.9% | 10.4% |
| Standard Deviation (Sample) | 24.0% | 9.8% |
| Standard Deviation (Population) | 23.9% | 9.7% |
Similar Demographics by Unemployment Among Ages 16 to 19 years
Demographics Similar to Natives/Alaskans by Unemployment Among Ages 16 to 19 years
In terms of unemployment among ages 16 to 19 years, the demographic groups most similar to Natives/Alaskans are Vietnamese (21.5%, a difference of 0.060%), Immigrants from Bangladesh (21.5%, a difference of 0.16%), Belizean (21.6%, a difference of 0.28%), Black/African American (21.4%, a difference of 0.54%), and Houma (21.6%, a difference of 0.54%).
| Demographics | Rating | Rank | Unemployment Among Ages 16 to 19 years |
| Immigrants | Caribbean | 0.0 /100 | #302 | Tragic 20.9% |
| Senegalese | 0.0 /100 | #303 | Tragic 21.0% |
| Aleuts | 0.0 /100 | #304 | Tragic 21.2% |
| Immigrants | Senegal | 0.0 /100 | #305 | Tragic 21.2% |
| U.S. Virgin Islanders | 0.0 /100 | #306 | Tragic 21.3% |
| Blacks/African Americans | 0.0 /100 | #307 | Tragic 21.4% |
| Immigrants | Bangladesh | 0.0 /100 | #308 | Tragic 21.5% |
| Natives/Alaskans | 0.0 /100 | #309 | Tragic 21.5% |
| Vietnamese | 0.0 /100 | #310 | Tragic 21.5% |
| Belizeans | 0.0 /100 | #311 | Tragic 21.6% |
| Houma | 0.0 /100 | #312 | Tragic 21.6% |
| Jamaicans | 0.0 /100 | #313 | Tragic 21.7% |
| Alaska Natives | 0.0 /100 | #314 | Tragic 21.8% |
| Immigrants | Dominica | 0.0 /100 | #315 | Tragic 21.9% |
| Tohono O'odham | 0.0 /100 | #316 | Tragic 22.1% |
Demographics Similar to Zimbabweans by Unemployment Among Ages 16 to 19 years
In terms of unemployment among ages 16 to 19 years, the demographic groups most similar to Zimbabweans are Scandinavian (15.4%, a difference of 0.11%), Indonesian (15.5%, a difference of 0.42%), Czech (15.4%, a difference of 0.44%), Taiwanese (15.5%, a difference of 0.52%), and Immigrants from Bosnia and Herzegovina (15.3%, a difference of 0.68%).
| Demographics | Rating | Rank | Unemployment Among Ages 16 to 19 years |
| Luxembourgers | 100.0 /100 | #3 | Exceptional 15.1% |
| Danes | 100.0 /100 | #4 | Exceptional 15.2% |
| Immigrants | Somalia | 100.0 /100 | #5 | Exceptional 15.3% |
| Swedes | 100.0 /100 | #6 | Exceptional 15.3% |
| Immigrants | Bosnia and Herzegovina | 100.0 /100 | #7 | Exceptional 15.3% |
| Czechs | 100.0 /100 | #8 | Exceptional 15.4% |
| Scandinavians | 100.0 /100 | #9 | Exceptional 15.4% |
| Zimbabweans | 100.0 /100 | #10 | Exceptional 15.4% |
| Indonesians | 100.0 /100 | #11 | Exceptional 15.5% |
| Taiwanese | 100.0 /100 | #12 | Exceptional 15.5% |
| Immigrants | Burma/Myanmar | 100.0 /100 | #13 | Exceptional 15.6% |
| Immigrants | Zaire | 100.0 /100 | #14 | Exceptional 15.6% |
| Yugoslavians | 100.0 /100 | #15 | Exceptional 15.6% |
| Germans | 100.0 /100 | #16 | Exceptional 15.7% |
| Somalis | 100.0 /100 | #17 | Exceptional 15.7% |