Hungarian vs Zimbabwean Family Households with Children
COMPARE
Hungarian
Zimbabwean
Family Households with Children
Family Households with Children Comparison
Hungarians
Zimbabweans
27.6%
FAMILY HOUSEHOLDS WITH CHILDREN
74.6/ 100
METRIC RATING
156th/ 347
METRIC RANK
27.9%
FAMILY HOUSEHOLDS WITH CHILDREN
95.6/ 100
METRIC RATING
119th/ 347
METRIC RANK
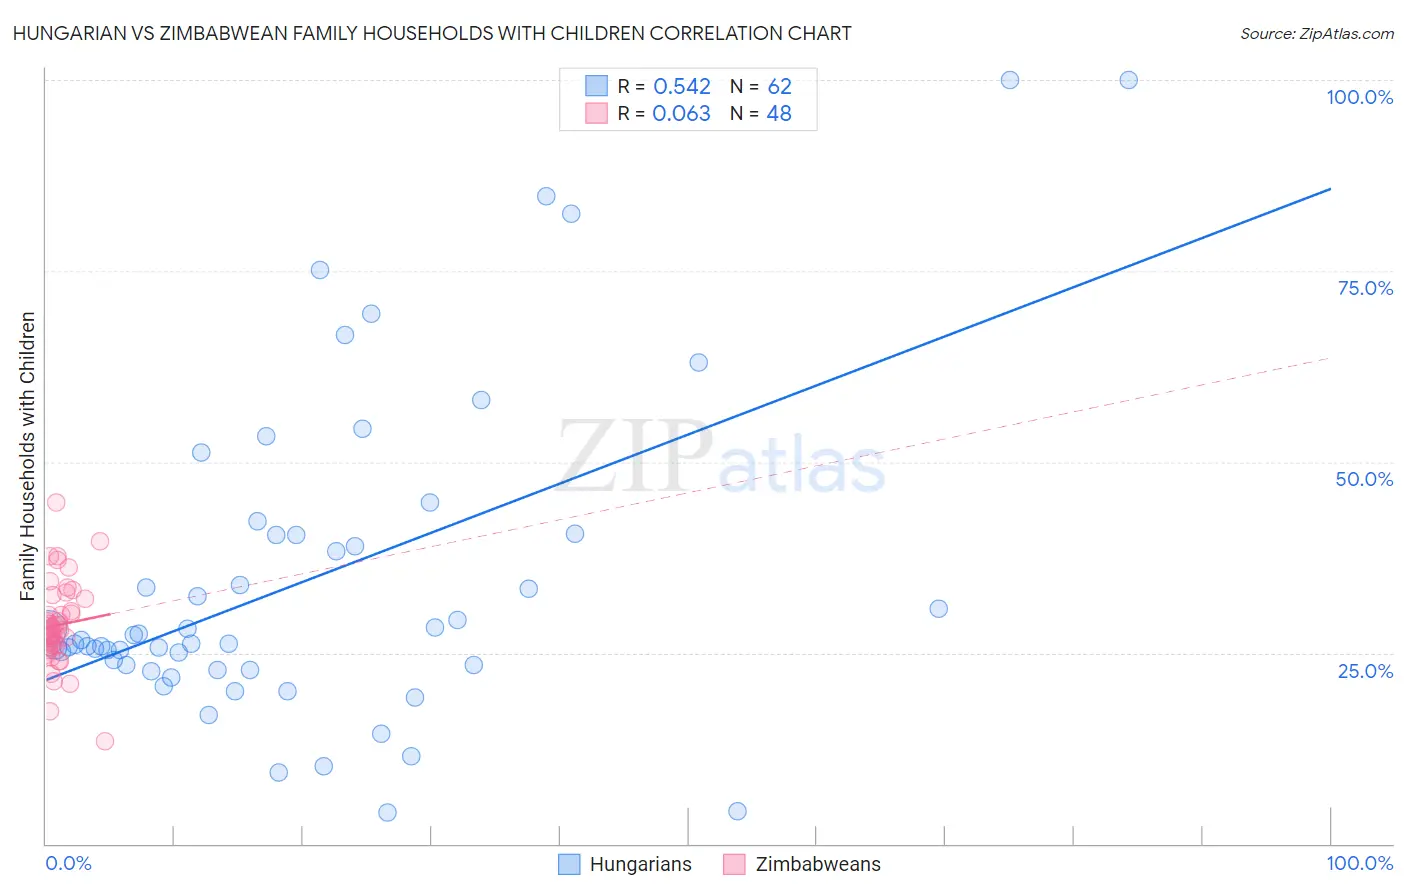
Hungarian vs Zimbabwean Family Households with Children Correlation Chart
The statistical analysis conducted on geographies consisting of 485,629,585 people shows a substantial positive correlation between the proportion of Hungarians and percentage of family households with children in the United States with a correlation coefficient (R) of 0.542 and weighted average of 27.6%. Similarly, the statistical analysis conducted on geographies consisting of 69,170,412 people shows a slight positive correlation between the proportion of Zimbabweans and percentage of family households with children in the United States with a correlation coefficient (R) of 0.063 and weighted average of 27.9%, a difference of 1.1%.
Family Households with Children Correlation Summary
| Measurement | Hungarian | Zimbabwean |
| Minimum | 4.2% | 13.4% |
| Maximum | 100.0% | 44.7% |
| Range | 95.8% | 31.3% |
| Mean | 34.7% | 28.6% |
| Median | 26.5% | 28.1% |
| Interquartile 25% (IQ1) | 23.3% | 25.8% |
| Interquartile 75% (IQ3) | 40.4% | 31.3% |
| Interquartile Range (IQR) | 17.1% | 5.4% |
| Standard Deviation (Sample) | 21.2% | 5.6% |
| Standard Deviation (Population) | 21.0% | 5.5% |
Similar Demographics by Family Households with Children
Demographics Similar to Hungarians by Family Households with Children
In terms of family households with children, the demographic groups most similar to Hungarians are Comanche (27.6%, a difference of 0.010%), Icelander (27.6%, a difference of 0.020%), Immigrants from Cabo Verde (27.6%, a difference of 0.030%), Ethiopian (27.6%, a difference of 0.070%), and Indian (Asian) (27.6%, a difference of 0.080%).
| Demographics | Rating | Rank | Family Households with Children |
| Menominee | 78.9 /100 | #149 | Good 27.6% |
| Argentineans | 78.5 /100 | #150 | Good 27.6% |
| Portuguese | 77.8 /100 | #151 | Good 27.6% |
| Ethiopians | 77.0 /100 | #152 | Good 27.6% |
| Immigrants | Cabo Verde | 75.6 /100 | #153 | Good 27.6% |
| Icelanders | 75.3 /100 | #154 | Good 27.6% |
| Comanche | 74.8 /100 | #155 | Good 27.6% |
| Hungarians | 74.6 /100 | #156 | Good 27.6% |
| Indians (Asian) | 71.6 /100 | #157 | Good 27.6% |
| Romanians | 70.8 /100 | #158 | Good 27.6% |
| Mongolians | 70.7 /100 | #159 | Good 27.6% |
| Sub-Saharan Africans | 67.5 /100 | #160 | Good 27.6% |
| Alaskan Athabascans | 67.1 /100 | #161 | Good 27.6% |
| Immigrants | Bangladesh | 67.0 /100 | #162 | Good 27.6% |
| Czechs | 65.3 /100 | #163 | Good 27.5% |
Demographics Similar to Zimbabweans by Family Households with Children
In terms of family households with children, the demographic groups most similar to Zimbabweans are European (27.9%, a difference of 0.030%), Immigrants from Malaysia (27.9%, a difference of 0.040%), Central American Indian (27.9%, a difference of 0.040%), Pakistani (27.9%, a difference of 0.050%), and Immigrants from Africa (28.0%, a difference of 0.18%).
| Demographics | Rating | Rank | Family Households with Children |
| Immigrants | Middle Africa | 97.0 /100 | #112 | Exceptional 28.0% |
| Arabs | 97.0 /100 | #113 | Exceptional 28.0% |
| South American Indians | 96.9 /100 | #114 | Exceptional 28.0% |
| Immigrants | Africa | 96.8 /100 | #115 | Exceptional 28.0% |
| Pakistanis | 96.0 /100 | #116 | Exceptional 27.9% |
| Immigrants | Malaysia | 95.9 /100 | #117 | Exceptional 27.9% |
| Central American Indians | 95.9 /100 | #118 | Exceptional 27.9% |
| Zimbabweans | 95.6 /100 | #119 | Exceptional 27.9% |
| Europeans | 95.4 /100 | #120 | Exceptional 27.9% |
| Immigrants | Western Asia | 93.6 /100 | #121 | Exceptional 27.9% |
| Immigrants | Zimbabwe | 92.8 /100 | #122 | Exceptional 27.8% |
| Immigrants | Northern Africa | 91.8 /100 | #123 | Exceptional 27.8% |
| Immigrants | Singapore | 90.8 /100 | #124 | Exceptional 27.8% |
| Ecuadorians | 90.8 /100 | #125 | Exceptional 27.8% |
| Immigrants | Ethiopia | 90.5 /100 | #126 | Exceptional 27.8% |