Taiwanese vs Immigrants from Ireland Currently Married
COMPARE
Taiwanese
Immigrants from Ireland
Currently Married
Currently Married Comparison
Taiwanese
Immigrants from Ireland
45.8%
CURRENTLY MARRIED
11.7/ 100
METRIC RATING
203rd/ 347
METRIC RANK
48.4%
CURRENTLY MARRIED
98.5/ 100
METRIC RATING
59th/ 347
METRIC RANK
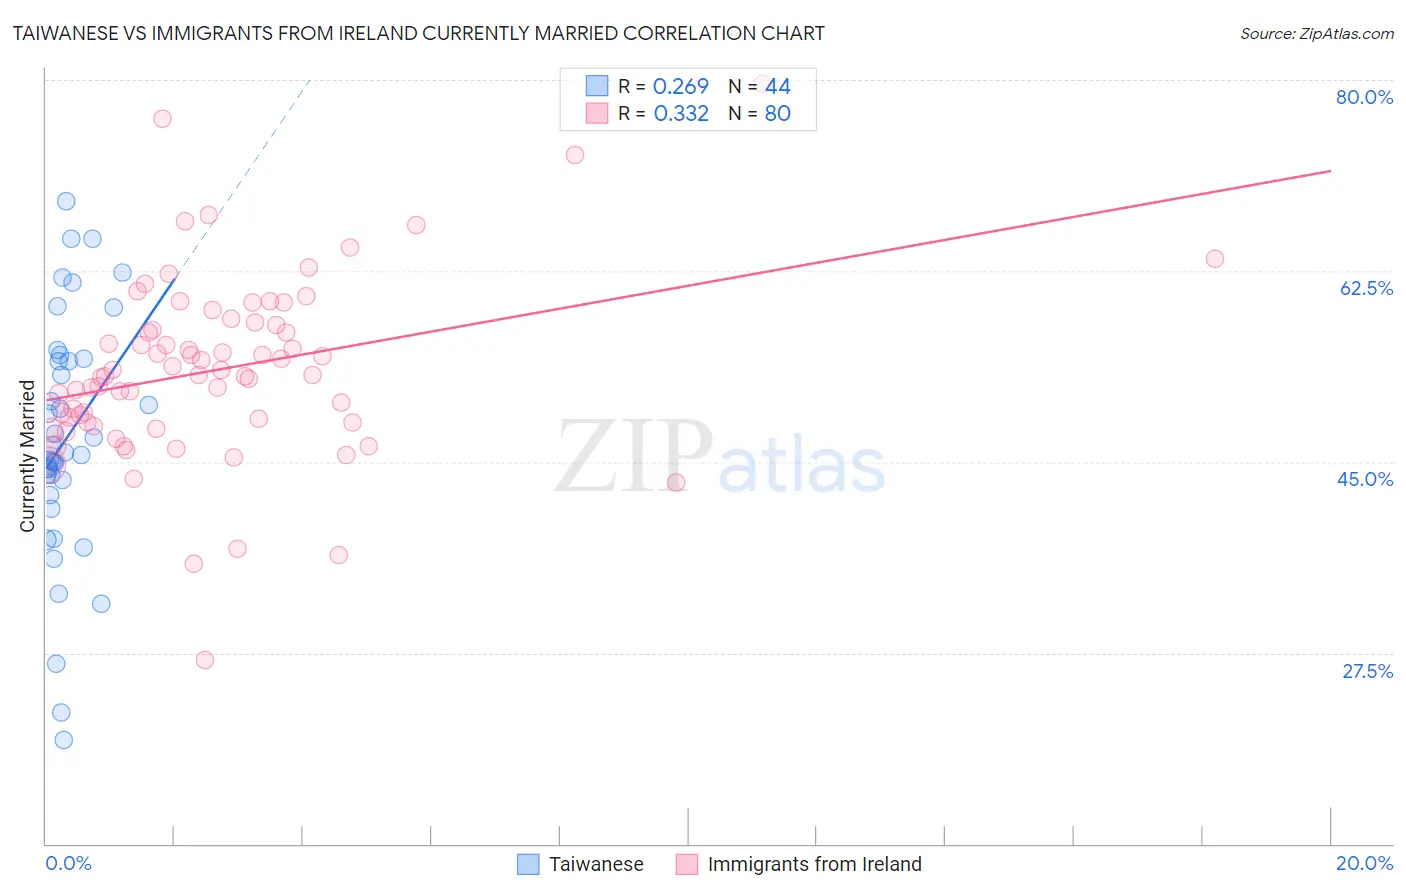
Taiwanese vs Immigrants from Ireland Currently Married Correlation Chart
The statistical analysis conducted on geographies consisting of 31,720,118 people shows a weak positive correlation between the proportion of Taiwanese and percentage of population currently married in the United States with a correlation coefficient (R) of 0.269 and weighted average of 45.8%. Similarly, the statistical analysis conducted on geographies consisting of 240,768,579 people shows a mild positive correlation between the proportion of Immigrants from Ireland and percentage of population currently married in the United States with a correlation coefficient (R) of 0.332 and weighted average of 48.4%, a difference of 5.8%.
Currently Married Correlation Summary
| Measurement | Taiwanese | Immigrants from Ireland |
| Minimum | 19.5% | 26.8% |
| Maximum | 68.9% | 79.7% |
| Range | 49.4% | 52.9% |
| Mean | 47.1% | 53.5% |
| Median | 45.8% | 53.0% |
| Interquartile 25% (IQ1) | 42.6% | 48.6% |
| Interquartile 75% (IQ3) | 54.4% | 57.7% |
| Interquartile Range (IQR) | 11.8% | 9.1% |
| Standard Deviation (Sample) | 11.0% | 8.4% |
| Standard Deviation (Population) | 10.9% | 8.4% |
Similar Demographics by Currently Married
Demographics Similar to Taiwanese by Currently Married
In terms of currently married, the demographic groups most similar to Taiwanese are Immigrants from Spain (45.8%, a difference of 0.010%), South American Indian (45.8%, a difference of 0.020%), Immigrants (45.8%, a difference of 0.040%), Immigrants from South America (45.7%, a difference of 0.080%), and Alsatian (45.7%, a difference of 0.090%).
| Demographics | Rating | Rank | Currently Married |
| Immigrants | Bosnia and Herzegovina | 22.2 /100 | #196 | Fair 46.1% |
| Immigrants | Kuwait | 21.7 /100 | #197 | Fair 46.1% |
| Immigrants | Colombia | 21.0 /100 | #198 | Fair 46.1% |
| Immigrants | Costa Rica | 19.6 /100 | #199 | Poor 46.0% |
| Creek | 17.2 /100 | #200 | Poor 46.0% |
| Malaysians | 15.3 /100 | #201 | Poor 45.9% |
| Immigrants | Albania | 14.5 /100 | #202 | Poor 45.9% |
| Taiwanese | 11.7 /100 | #203 | Poor 45.8% |
| Immigrants | Spain | 11.6 /100 | #204 | Poor 45.8% |
| South American Indians | 11.5 /100 | #205 | Poor 45.8% |
| Immigrants | Immigrants | 11.2 /100 | #206 | Poor 45.8% |
| Immigrants | South America | 10.8 /100 | #207 | Poor 45.7% |
| Alsatians | 10.8 /100 | #208 | Poor 45.7% |
| Immigrants | Micronesia | 8.8 /100 | #209 | Tragic 45.6% |
| Uruguayans | 7.9 /100 | #210 | Tragic 45.6% |
Demographics Similar to Immigrants from Ireland by Currently Married
In terms of currently married, the demographic groups most similar to Immigrants from Ireland are Immigrants from Romania (48.4%, a difference of 0.010%), French (48.4%, a difference of 0.030%), Romanian (48.4%, a difference of 0.030%), Asian (48.4%, a difference of 0.030%), and Immigrants from Netherlands (48.5%, a difference of 0.070%).
| Demographics | Rating | Rank | Currently Married |
| Russians | 98.9 /100 | #52 | Exceptional 48.6% |
| Immigrants | Austria | 98.8 /100 | #53 | Exceptional 48.5% |
| Immigrants | Moldova | 98.7 /100 | #54 | Exceptional 48.5% |
| Immigrants | North Macedonia | 98.7 /100 | #55 | Exceptional 48.5% |
| Latvians | 98.7 /100 | #56 | Exceptional 48.5% |
| Immigrants | Netherlands | 98.6 /100 | #57 | Exceptional 48.5% |
| French | 98.6 /100 | #58 | Exceptional 48.4% |
| Immigrants | Ireland | 98.5 /100 | #59 | Exceptional 48.4% |
| Immigrants | Romania | 98.5 /100 | #60 | Exceptional 48.4% |
| Romanians | 98.5 /100 | #61 | Exceptional 48.4% |
| Asians | 98.5 /100 | #62 | Exceptional 48.4% |
| Slavs | 98.3 /100 | #63 | Exceptional 48.4% |
| Immigrants | Czechoslovakia | 98.3 /100 | #64 | Exceptional 48.4% |
| Ukrainians | 98.3 /100 | #65 | Exceptional 48.4% |
| Tongans | 98.2 /100 | #66 | Exceptional 48.3% |