Arapaho vs Immigrants from Ireland Currently Married
COMPARE
Arapaho
Immigrants from Ireland
Currently Married
Currently Married Comparison
Arapaho
Immigrants from Ireland
40.5%
CURRENTLY MARRIED
0.0/ 100
METRIC RATING
328th/ 347
METRIC RANK
48.4%
CURRENTLY MARRIED
98.5/ 100
METRIC RATING
59th/ 347
METRIC RANK
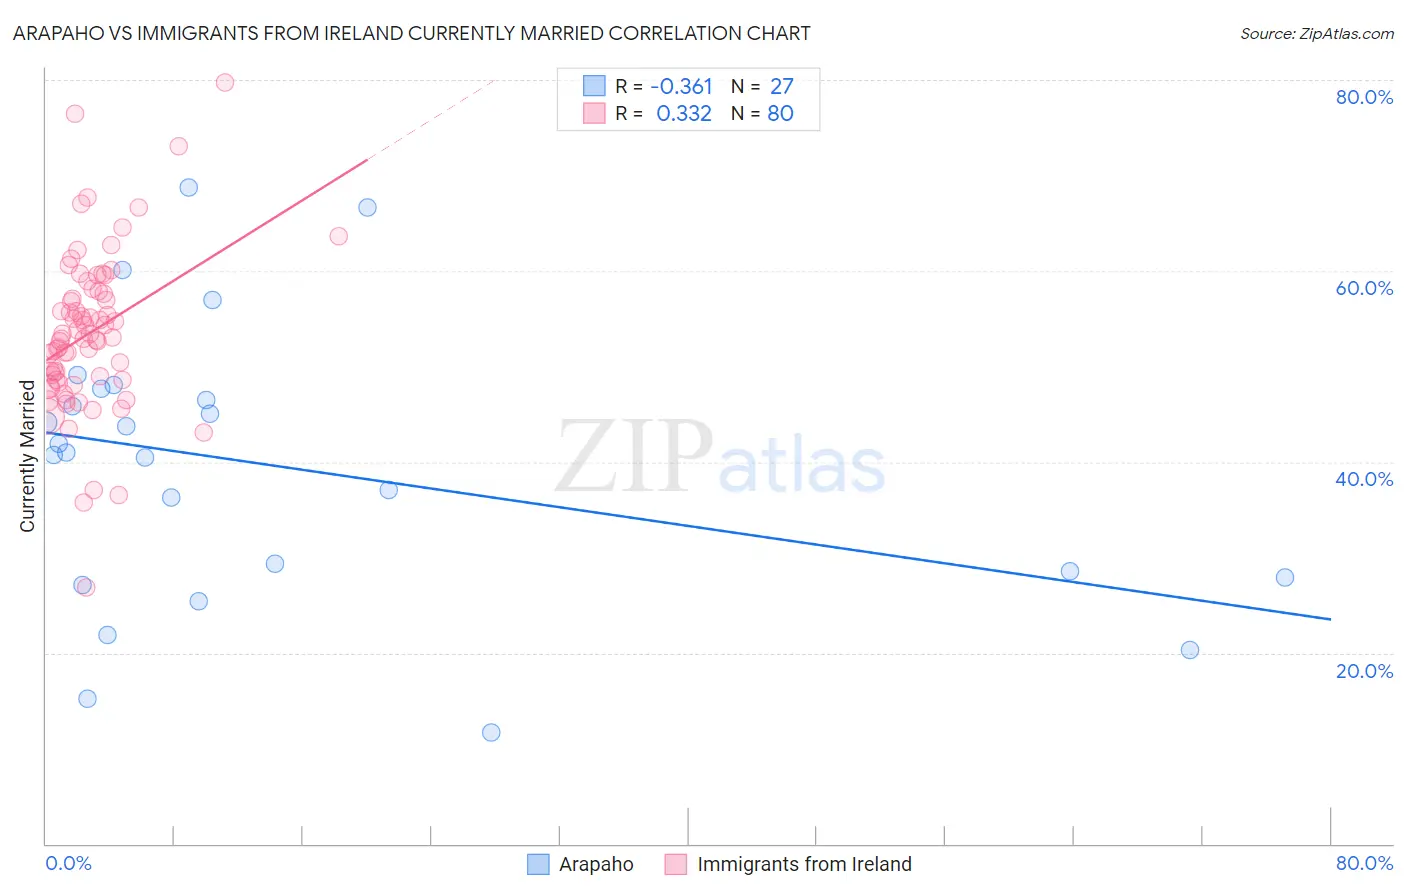
Arapaho vs Immigrants from Ireland Currently Married Correlation Chart
The statistical analysis conducted on geographies consisting of 29,779,567 people shows a mild negative correlation between the proportion of Arapaho and percentage of population currently married in the United States with a correlation coefficient (R) of -0.361 and weighted average of 40.5%. Similarly, the statistical analysis conducted on geographies consisting of 240,768,579 people shows a mild positive correlation between the proportion of Immigrants from Ireland and percentage of population currently married in the United States with a correlation coefficient (R) of 0.332 and weighted average of 48.4%, a difference of 19.4%.
Currently Married Correlation Summary
| Measurement | Arapaho | Immigrants from Ireland |
| Minimum | 11.7% | 26.8% |
| Maximum | 68.7% | 79.7% |
| Range | 57.0% | 52.9% |
| Mean | 39.5% | 53.5% |
| Median | 41.0% | 53.0% |
| Interquartile 25% (IQ1) | 27.9% | 48.6% |
| Interquartile 75% (IQ3) | 47.6% | 57.7% |
| Interquartile Range (IQR) | 19.7% | 9.1% |
| Standard Deviation (Sample) | 14.5% | 8.4% |
| Standard Deviation (Population) | 14.3% | 8.4% |
Similar Demographics by Currently Married
Demographics Similar to Arapaho by Currently Married
In terms of currently married, the demographic groups most similar to Arapaho are Senegalese (40.6%, a difference of 0.040%), Barbadian (40.6%, a difference of 0.22%), U.S. Virgin Islander (40.7%, a difference of 0.35%), Immigrants from Senegal (40.7%, a difference of 0.40%), and Immigrants from West Indies (40.7%, a difference of 0.41%).
| Demographics | Rating | Rank | Currently Married |
| Immigrants | Congo | 0.0 /100 | #321 | Tragic 41.1% |
| Immigrants | Haiti | 0.0 /100 | #322 | Tragic 41.0% |
| Immigrants | West Indies | 0.0 /100 | #323 | Tragic 40.7% |
| Immigrants | Senegal | 0.0 /100 | #324 | Tragic 40.7% |
| U.S. Virgin Islanders | 0.0 /100 | #325 | Tragic 40.7% |
| Barbadians | 0.0 /100 | #326 | Tragic 40.6% |
| Senegalese | 0.0 /100 | #327 | Tragic 40.6% |
| Arapaho | 0.0 /100 | #328 | Tragic 40.5% |
| Crow | 0.0 /100 | #329 | Tragic 40.4% |
| Immigrants | Dominica | 0.0 /100 | #330 | Tragic 40.3% |
| Immigrants | Barbados | 0.0 /100 | #331 | Tragic 40.3% |
| Immigrants | St. Vincent and the Grenadines | 0.0 /100 | #332 | Tragic 40.1% |
| Yup'ik | 0.0 /100 | #333 | Tragic 39.9% |
| Puerto Ricans | 0.0 /100 | #334 | Tragic 39.9% |
| Lumbee | 0.0 /100 | #335 | Tragic 39.8% |
Demographics Similar to Immigrants from Ireland by Currently Married
In terms of currently married, the demographic groups most similar to Immigrants from Ireland are Immigrants from Romania (48.4%, a difference of 0.010%), French (48.4%, a difference of 0.030%), Romanian (48.4%, a difference of 0.030%), Asian (48.4%, a difference of 0.030%), and Immigrants from Netherlands (48.5%, a difference of 0.070%).
| Demographics | Rating | Rank | Currently Married |
| Russians | 98.9 /100 | #52 | Exceptional 48.6% |
| Immigrants | Austria | 98.8 /100 | #53 | Exceptional 48.5% |
| Immigrants | Moldova | 98.7 /100 | #54 | Exceptional 48.5% |
| Immigrants | North Macedonia | 98.7 /100 | #55 | Exceptional 48.5% |
| Latvians | 98.7 /100 | #56 | Exceptional 48.5% |
| Immigrants | Netherlands | 98.6 /100 | #57 | Exceptional 48.5% |
| French | 98.6 /100 | #58 | Exceptional 48.4% |
| Immigrants | Ireland | 98.5 /100 | #59 | Exceptional 48.4% |
| Immigrants | Romania | 98.5 /100 | #60 | Exceptional 48.4% |
| Romanians | 98.5 /100 | #61 | Exceptional 48.4% |
| Asians | 98.5 /100 | #62 | Exceptional 48.4% |
| Slavs | 98.3 /100 | #63 | Exceptional 48.4% |
| Immigrants | Czechoslovakia | 98.3 /100 | #64 | Exceptional 48.4% |
| Ukrainians | 98.3 /100 | #65 | Exceptional 48.4% |
| Tongans | 98.2 /100 | #66 | Exceptional 48.3% |