Maltese vs Immigrants from Ireland Currently Married
COMPARE
Maltese
Immigrants from Ireland
Currently Married
Currently Married Comparison
Maltese
Immigrants from Ireland
49.0%
CURRENTLY MARRIED
99.6/ 100
METRIC RATING
25th/ 347
METRIC RANK
48.4%
CURRENTLY MARRIED
98.5/ 100
METRIC RATING
59th/ 347
METRIC RANK
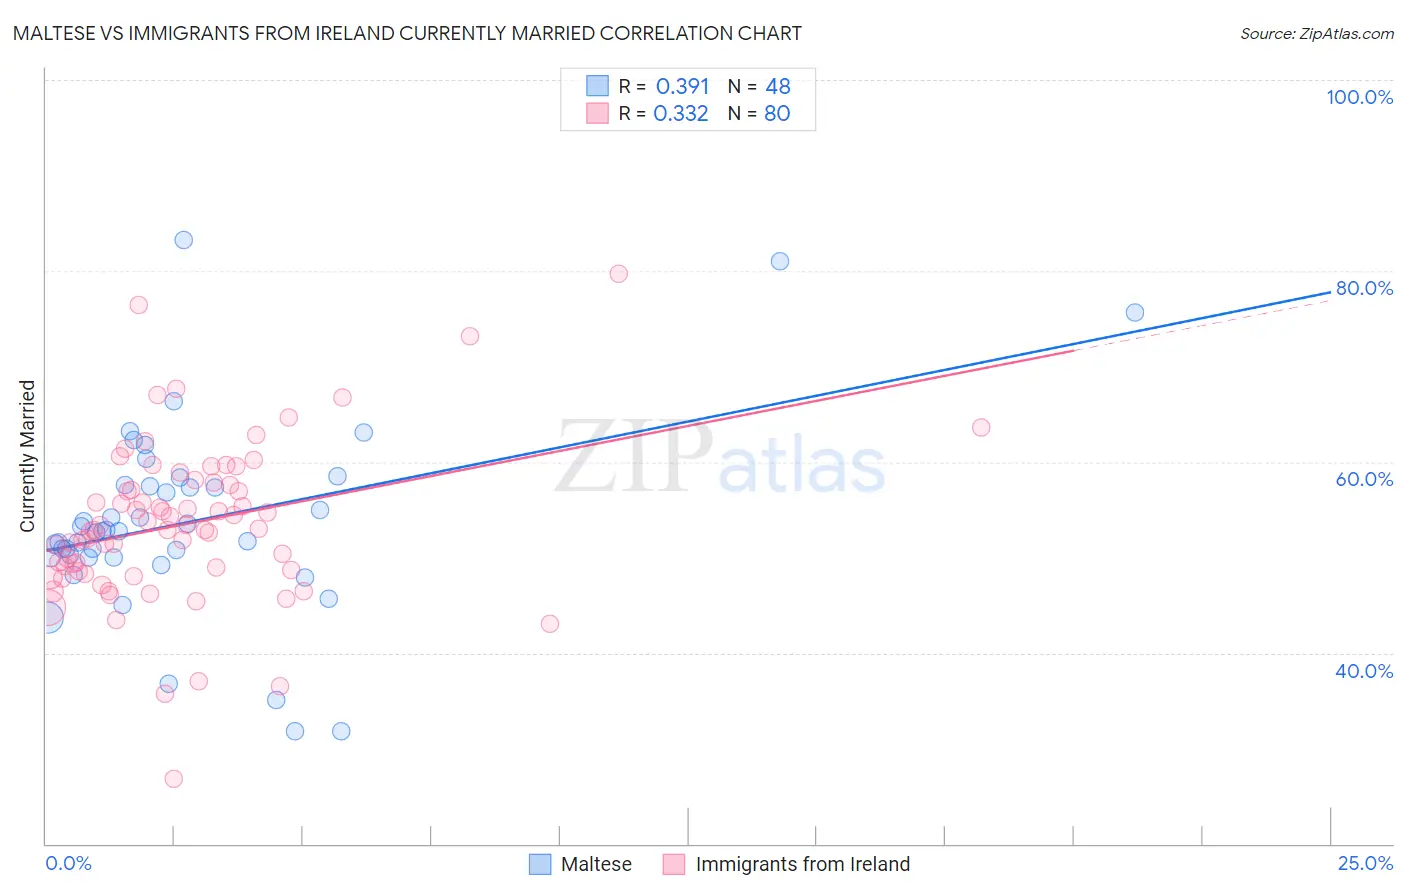
Maltese vs Immigrants from Ireland Currently Married Correlation Chart
The statistical analysis conducted on geographies consisting of 126,466,050 people shows a mild positive correlation between the proportion of Maltese and percentage of population currently married in the United States with a correlation coefficient (R) of 0.391 and weighted average of 49.0%. Similarly, the statistical analysis conducted on geographies consisting of 240,768,579 people shows a mild positive correlation between the proportion of Immigrants from Ireland and percentage of population currently married in the United States with a correlation coefficient (R) of 0.332 and weighted average of 48.4%, a difference of 1.2%.
Currently Married Correlation Summary
| Measurement | Maltese | Immigrants from Ireland |
| Minimum | 31.8% | 26.8% |
| Maximum | 83.3% | 79.7% |
| Range | 51.5% | 52.9% |
| Mean | 53.8% | 53.5% |
| Median | 52.8% | 53.0% |
| Interquartile 25% (IQ1) | 50.0% | 48.6% |
| Interquartile 75% (IQ3) | 57.5% | 57.7% |
| Interquartile Range (IQR) | 7.5% | 9.1% |
| Standard Deviation (Sample) | 10.1% | 8.4% |
| Standard Deviation (Population) | 10.0% | 8.4% |
Similar Demographics by Currently Married
Demographics Similar to Maltese by Currently Married
In terms of currently married, the demographic groups most similar to Maltese are Lithuanian (49.0%, a difference of 0.010%), Immigrants from Korea (49.0%, a difference of 0.050%), Immigrants from Pakistan (49.1%, a difference of 0.12%), Burmese (48.9%, a difference of 0.12%), and Welsh (48.9%, a difference of 0.16%).
| Demographics | Rating | Rank | Currently Married |
| Immigrants | Scotland | 99.8 /100 | #18 | Exceptional 49.3% |
| Europeans | 99.8 /100 | #19 | Exceptional 49.3% |
| Luxembourgers | 99.8 /100 | #20 | Exceptional 49.3% |
| Scottish | 99.8 /100 | #21 | Exceptional 49.2% |
| Bulgarians | 99.7 /100 | #22 | Exceptional 49.1% |
| Immigrants | Pakistan | 99.7 /100 | #23 | Exceptional 49.1% |
| Lithuanians | 99.6 /100 | #24 | Exceptional 49.0% |
| Maltese | 99.6 /100 | #25 | Exceptional 49.0% |
| Immigrants | Korea | 99.6 /100 | #26 | Exceptional 49.0% |
| Burmese | 99.6 /100 | #27 | Exceptional 48.9% |
| Welsh | 99.5 /100 | #28 | Exceptional 48.9% |
| Croatians | 99.5 /100 | #29 | Exceptional 48.9% |
| Eastern Europeans | 99.5 /100 | #30 | Exceptional 48.9% |
| Poles | 99.5 /100 | #31 | Exceptional 48.9% |
| Immigrants | Hong Kong | 99.5 /100 | #32 | Exceptional 48.9% |
Demographics Similar to Immigrants from Ireland by Currently Married
In terms of currently married, the demographic groups most similar to Immigrants from Ireland are Immigrants from Romania (48.4%, a difference of 0.010%), French (48.4%, a difference of 0.030%), Romanian (48.4%, a difference of 0.030%), Asian (48.4%, a difference of 0.030%), and Immigrants from Netherlands (48.5%, a difference of 0.070%).
| Demographics | Rating | Rank | Currently Married |
| Russians | 98.9 /100 | #52 | Exceptional 48.6% |
| Immigrants | Austria | 98.8 /100 | #53 | Exceptional 48.5% |
| Immigrants | Moldova | 98.7 /100 | #54 | Exceptional 48.5% |
| Immigrants | North Macedonia | 98.7 /100 | #55 | Exceptional 48.5% |
| Latvians | 98.7 /100 | #56 | Exceptional 48.5% |
| Immigrants | Netherlands | 98.6 /100 | #57 | Exceptional 48.5% |
| French | 98.6 /100 | #58 | Exceptional 48.4% |
| Immigrants | Ireland | 98.5 /100 | #59 | Exceptional 48.4% |
| Immigrants | Romania | 98.5 /100 | #60 | Exceptional 48.4% |
| Romanians | 98.5 /100 | #61 | Exceptional 48.4% |
| Asians | 98.5 /100 | #62 | Exceptional 48.4% |
| Slavs | 98.3 /100 | #63 | Exceptional 48.4% |
| Immigrants | Czechoslovakia | 98.3 /100 | #64 | Exceptional 48.4% |
| Ukrainians | 98.3 /100 | #65 | Exceptional 48.4% |
| Tongans | 98.2 /100 | #66 | Exceptional 48.3% |