Brazilian vs Immigrants from Ireland Currently Married
COMPARE
Brazilian
Immigrants from Ireland
Currently Married
Currently Married Comparison
Brazilians
Immigrants from Ireland
46.4%
CURRENTLY MARRIED
39.3/ 100
METRIC RATING
184th/ 347
METRIC RANK
48.4%
CURRENTLY MARRIED
98.5/ 100
METRIC RATING
59th/ 347
METRIC RANK
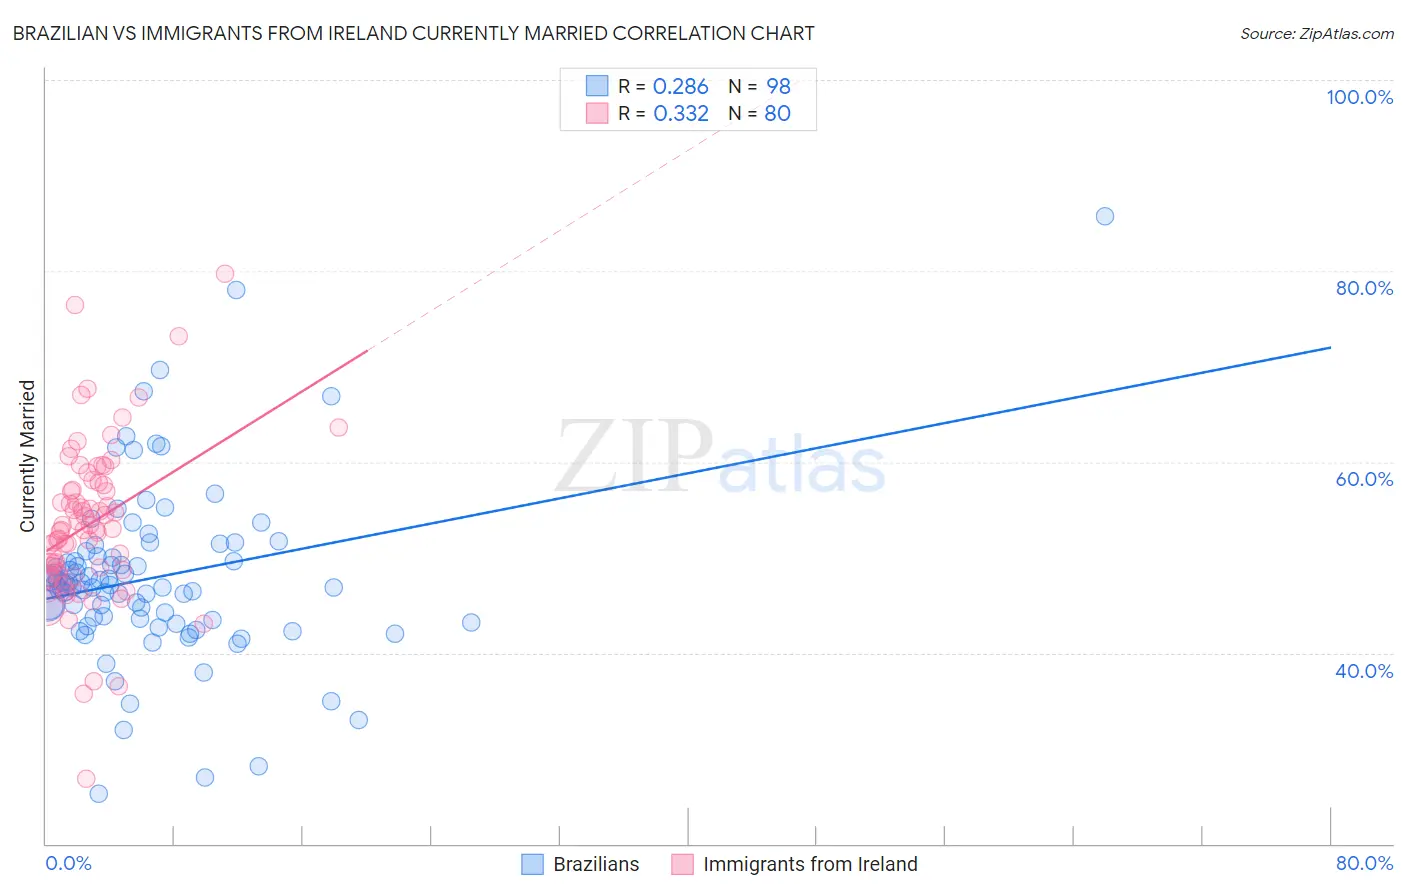
Brazilian vs Immigrants from Ireland Currently Married Correlation Chart
The statistical analysis conducted on geographies consisting of 323,904,544 people shows a weak positive correlation between the proportion of Brazilians and percentage of population currently married in the United States with a correlation coefficient (R) of 0.286 and weighted average of 46.4%. Similarly, the statistical analysis conducted on geographies consisting of 240,768,579 people shows a mild positive correlation between the proportion of Immigrants from Ireland and percentage of population currently married in the United States with a correlation coefficient (R) of 0.332 and weighted average of 48.4%, a difference of 4.3%.
Currently Married Correlation Summary
| Measurement | Brazilian | Immigrants from Ireland |
| Minimum | 25.3% | 26.8% |
| Maximum | 85.7% | 79.7% |
| Range | 60.4% | 52.9% |
| Mean | 47.9% | 53.5% |
| Median | 47.2% | 53.0% |
| Interquartile 25% (IQ1) | 43.5% | 48.6% |
| Interquartile 75% (IQ3) | 50.1% | 57.7% |
| Interquartile Range (IQR) | 6.6% | 9.1% |
| Standard Deviation (Sample) | 9.1% | 8.4% |
| Standard Deviation (Population) | 9.1% | 8.4% |
Similar Demographics by Currently Married
Demographics Similar to Brazilians by Currently Married
In terms of currently married, the demographic groups most similar to Brazilians are Immigrants from Northern Africa (46.5%, a difference of 0.020%), Mongolian (46.4%, a difference of 0.070%), Potawatomi (46.5%, a difference of 0.10%), Immigrants from Chile (46.4%, a difference of 0.10%), and Ottawa (46.5%, a difference of 0.14%).
| Demographics | Rating | Rank | Currently Married |
| Israelis | 48.6 /100 | #177 | Average 46.6% |
| Chickasaw | 47.8 /100 | #178 | Average 46.6% |
| Immigrants | Oceania | 44.6 /100 | #179 | Average 46.5% |
| Costa Ricans | 43.7 /100 | #180 | Average 46.5% |
| Ottawa | 43.0 /100 | #181 | Average 46.5% |
| Potawatomi | 41.9 /100 | #182 | Average 46.5% |
| Immigrants | Northern Africa | 39.7 /100 | #183 | Fair 46.5% |
| Brazilians | 39.3 /100 | #184 | Fair 46.4% |
| Mongolians | 37.6 /100 | #185 | Fair 46.4% |
| Immigrants | Chile | 36.8 /100 | #186 | Fair 46.4% |
| Immigrants | Peru | 35.3 /100 | #187 | Fair 46.4% |
| Colombians | 31.8 /100 | #188 | Fair 46.3% |
| Fijians | 30.3 /100 | #189 | Fair 46.3% |
| Choctaw | 29.1 /100 | #190 | Fair 46.3% |
| Immigrants | France | 27.7 /100 | #191 | Fair 46.2% |
Demographics Similar to Immigrants from Ireland by Currently Married
In terms of currently married, the demographic groups most similar to Immigrants from Ireland are Immigrants from Romania (48.4%, a difference of 0.010%), French (48.4%, a difference of 0.030%), Romanian (48.4%, a difference of 0.030%), Asian (48.4%, a difference of 0.030%), and Immigrants from Netherlands (48.5%, a difference of 0.070%).
| Demographics | Rating | Rank | Currently Married |
| Russians | 98.9 /100 | #52 | Exceptional 48.6% |
| Immigrants | Austria | 98.8 /100 | #53 | Exceptional 48.5% |
| Immigrants | Moldova | 98.7 /100 | #54 | Exceptional 48.5% |
| Immigrants | North Macedonia | 98.7 /100 | #55 | Exceptional 48.5% |
| Latvians | 98.7 /100 | #56 | Exceptional 48.5% |
| Immigrants | Netherlands | 98.6 /100 | #57 | Exceptional 48.5% |
| French | 98.6 /100 | #58 | Exceptional 48.4% |
| Immigrants | Ireland | 98.5 /100 | #59 | Exceptional 48.4% |
| Immigrants | Romania | 98.5 /100 | #60 | Exceptional 48.4% |
| Romanians | 98.5 /100 | #61 | Exceptional 48.4% |
| Asians | 98.5 /100 | #62 | Exceptional 48.4% |
| Slavs | 98.3 /100 | #63 | Exceptional 48.4% |
| Immigrants | Czechoslovakia | 98.3 /100 | #64 | Exceptional 48.4% |
| Ukrainians | 98.3 /100 | #65 | Exceptional 48.4% |
| Tongans | 98.2 /100 | #66 | Exceptional 48.3% |