Somali vs Immigrants from Cuba Family Households with Children
COMPARE
Somali
Immigrants from Cuba
Family Households with Children
Family Households with Children Comparison
Somalis
Immigrants from Cuba
26.7%
FAMILY HOUSEHOLDS WITH CHILDREN
0.7/ 100
METRIC RATING
272nd/ 347
METRIC RANK
26.8%
FAMILY HOUSEHOLDS WITH CHILDREN
1.3/ 100
METRIC RATING
258th/ 347
METRIC RANK
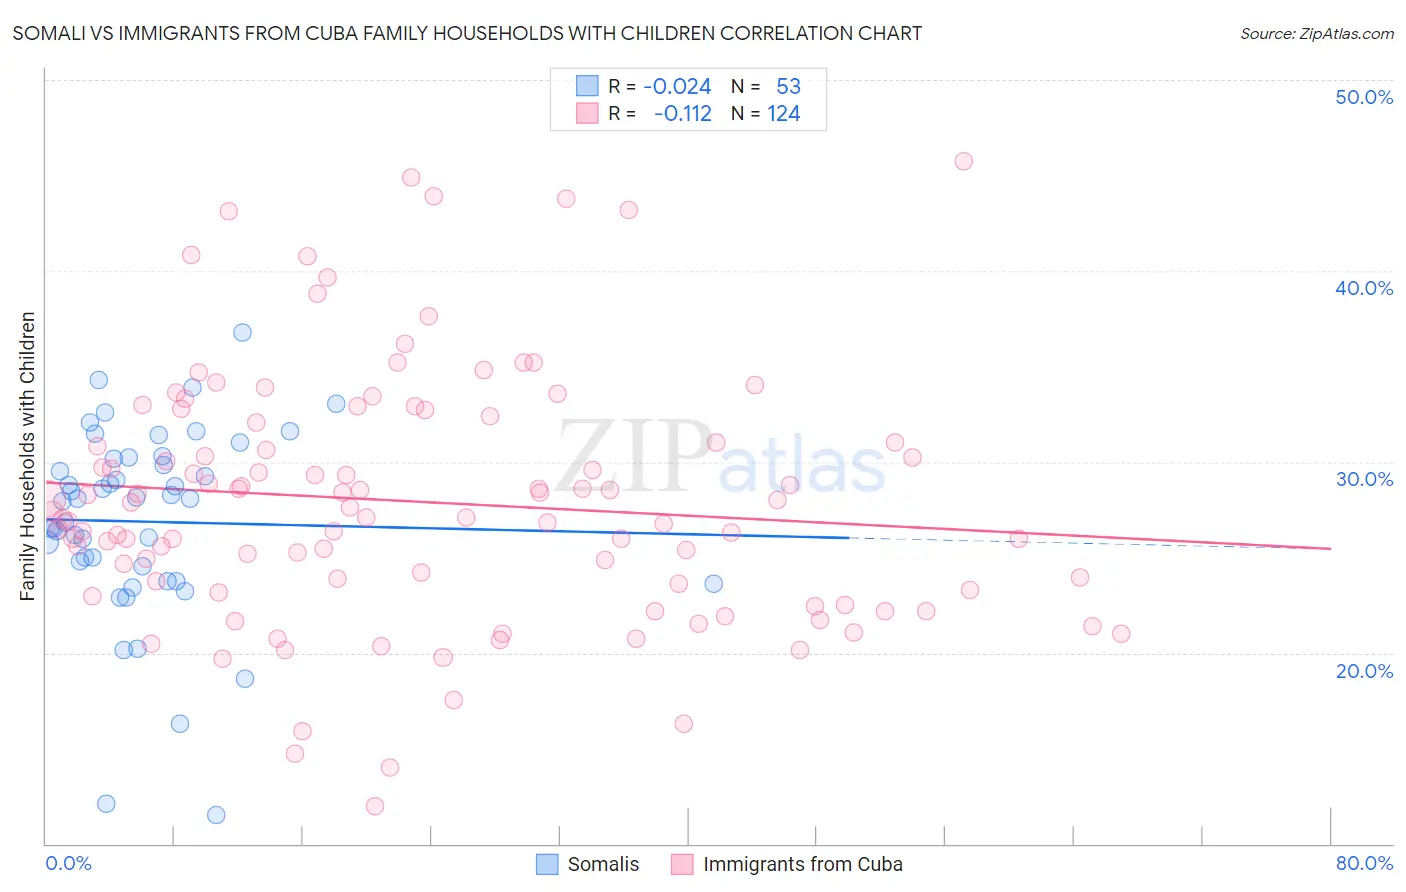
Somali vs Immigrants from Cuba Family Households with Children Correlation Chart
The statistical analysis conducted on geographies consisting of 99,290,252 people shows no correlation between the proportion of Somalis and percentage of family households with children in the United States with a correlation coefficient (R) of -0.024 and weighted average of 26.7%. Similarly, the statistical analysis conducted on geographies consisting of 325,830,248 people shows a poor negative correlation between the proportion of Immigrants from Cuba and percentage of family households with children in the United States with a correlation coefficient (R) of -0.112 and weighted average of 26.8%, a difference of 0.39%.
Family Households with Children Correlation Summary
| Measurement | Somali | Immigrants from Cuba |
| Minimum | 11.5% | 11.9% |
| Maximum | 36.8% | 45.7% |
| Range | 25.3% | 33.8% |
| Mean | 26.9% | 27.9% |
| Median | 28.1% | 27.3% |
| Interquartile 25% (IQ1) | 24.2% | 23.4% |
| Interquartile 75% (IQ3) | 30.2% | 31.5% |
| Interquartile Range (IQR) | 6.1% | 8.1% |
| Standard Deviation (Sample) | 5.0% | 6.6% |
| Standard Deviation (Population) | 5.0% | 6.6% |
Demographics Similar to Somalis and Immigrants from Cuba by Family Households with Children
In terms of family households with children, the demographic groups most similar to Somalis are Immigrants from Hungary (26.7%, a difference of 0.030%), Eastern European (26.7%, a difference of 0.040%), French (26.7%, a difference of 0.060%), Immigrants from Zaire (26.7%, a difference of 0.080%), and Immigrants from Northern Europe (26.7%, a difference of 0.12%). Similarly, the demographic groups most similar to Immigrants from Cuba are Slavic (26.8%, a difference of 0.010%), Immigrants from Lithuania (26.8%, a difference of 0.030%), Scotch-Irish (26.8%, a difference of 0.050%), Immigrants from Jamaica (26.8%, a difference of 0.050%), and German Russian (26.8%, a difference of 0.070%).
| Demographics | Rating | Rank | Family Households with Children |
| German Russians | 1.5 /100 | #255 | Tragic 26.8% |
| Scotch-Irish | 1.4 /100 | #256 | Tragic 26.8% |
| Slavs | 1.3 /100 | #257 | Tragic 26.8% |
| Immigrants | Cuba | 1.3 /100 | #258 | Tragic 26.8% |
| Immigrants | Lithuania | 1.2 /100 | #259 | Tragic 26.8% |
| Immigrants | Jamaica | 1.2 /100 | #260 | Tragic 26.8% |
| Immigrants | Belarus | 1.1 /100 | #261 | Tragic 26.8% |
| Immigrants | Russia | 1.0 /100 | #262 | Tragic 26.8% |
| Immigrants | North Macedonia | 1.0 /100 | #263 | Tragic 26.7% |
| Taiwanese | 0.9 /100 | #264 | Tragic 26.7% |
| Chippewa | 0.9 /100 | #265 | Tragic 26.7% |
| Maltese | 0.9 /100 | #266 | Tragic 26.7% |
| Immigrants | Uzbekistan | 0.9 /100 | #267 | Tragic 26.7% |
| Immigrants | Belgium | 0.9 /100 | #268 | Tragic 26.7% |
| Immigrants | Denmark | 0.8 /100 | #269 | Tragic 26.7% |
| Immigrants | Zaire | 0.7 /100 | #270 | Tragic 26.7% |
| French | 0.7 /100 | #271 | Tragic 26.7% |
| Somalis | 0.7 /100 | #272 | Tragic 26.7% |
| Immigrants | Hungary | 0.6 /100 | #273 | Tragic 26.7% |
| Eastern Europeans | 0.6 /100 | #274 | Tragic 26.7% |
| Immigrants | Northern Europe | 0.5 /100 | #275 | Tragic 26.7% |