Immigrants from Oceania vs Immigrants from Afghanistan Divorced or Separated
COMPARE
Immigrants from Oceania
Immigrants from Afghanistan
Divorced or Separated
Divorced or Separated Comparison
Immigrants from Oceania
Immigrants from Afghanistan
11.9%
DIVORCED OR SEPARATED
77.7/ 100
METRIC RATING
149th/ 347
METRIC RANK
11.8%
DIVORCED OR SEPARATED
87.9/ 100
METRIC RATING
132nd/ 347
METRIC RANK
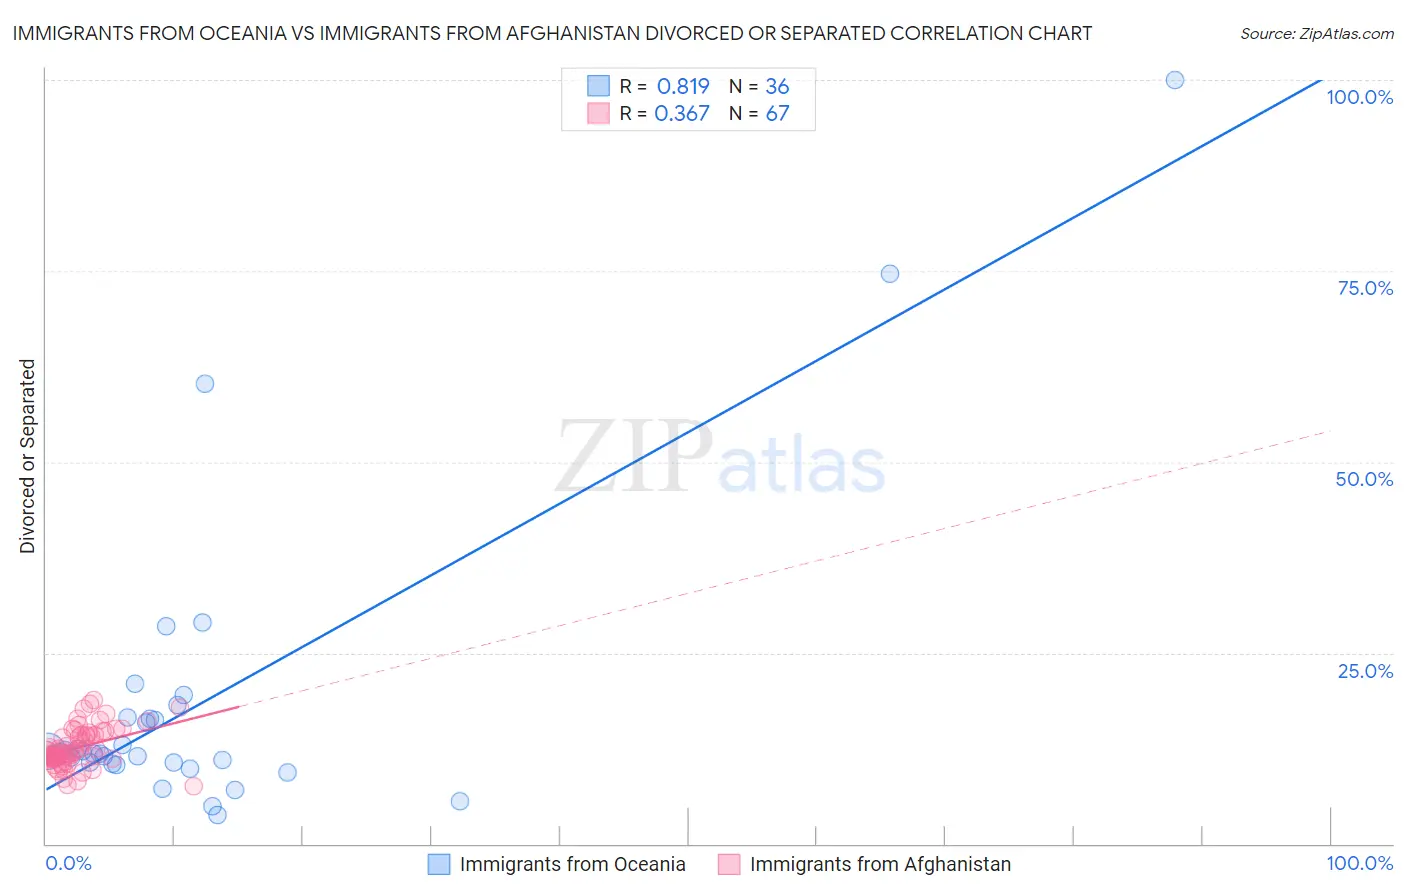
Immigrants from Oceania vs Immigrants from Afghanistan Divorced or Separated Correlation Chart
The statistical analysis conducted on geographies consisting of 305,431,368 people shows a very strong positive correlation between the proportion of Immigrants from Oceania and percentage of population currently divorced or separated in the United States with a correlation coefficient (R) of 0.819 and weighted average of 11.9%. Similarly, the statistical analysis conducted on geographies consisting of 147,642,734 people shows a mild positive correlation between the proportion of Immigrants from Afghanistan and percentage of population currently divorced or separated in the United States with a correlation coefficient (R) of 0.367 and weighted average of 11.8%, a difference of 0.65%.
Divorced or Separated Correlation Summary
| Measurement | Immigrants from Oceania | Immigrants from Afghanistan |
| Minimum | 3.7% | 7.5% |
| Maximum | 100.0% | 18.8% |
| Range | 96.3% | 11.3% |
| Mean | 18.3% | 12.6% |
| Median | 11.9% | 12.0% |
| Interquartile 25% (IQ1) | 10.5% | 11.2% |
| Interquartile 75% (IQ3) | 16.5% | 14.3% |
| Interquartile Range (IQR) | 5.9% | 3.1% |
| Standard Deviation (Sample) | 19.7% | 2.5% |
| Standard Deviation (Population) | 19.4% | 2.5% |
Demographics Similar to Immigrants from Oceania and Immigrants from Afghanistan by Divorced or Separated
In terms of divorced or separated, the demographic groups most similar to Immigrants from Oceania are Italian (11.9%, a difference of 0.0%), Immigrants from Portugal (11.9%, a difference of 0.020%), Polish (11.9%, a difference of 0.050%), Immigrants from Grenada (11.9%, a difference of 0.070%), and Croatian (11.9%, a difference of 0.15%). Similarly, the demographic groups most similar to Immigrants from Afghanistan are Immigrants from Austria (11.8%, a difference of 0.030%), Immigrants from Cambodia (11.8%, a difference of 0.030%), New Zealander (11.9%, a difference of 0.030%), Argentinean (11.9%, a difference of 0.21%), and Danish (11.9%, a difference of 0.23%).
| Demographics | Rating | Rank | Divorced or Separated |
| Immigrants | Austria | 88.2 /100 | #130 | Excellent 11.8% |
| Immigrants | Cambodia | 88.2 /100 | #131 | Excellent 11.8% |
| Immigrants | Afghanistan | 87.9 /100 | #132 | Excellent 11.8% |
| New Zealanders | 87.5 /100 | #133 | Excellent 11.9% |
| Argentineans | 85.1 /100 | #134 | Excellent 11.9% |
| Danes | 84.8 /100 | #135 | Excellent 11.9% |
| Carpatho Rusyns | 84.8 /100 | #136 | Excellent 11.9% |
| Alsatians | 84.0 /100 | #137 | Excellent 11.9% |
| Immigrants | Netherlands | 83.9 /100 | #138 | Excellent 11.9% |
| Australians | 83.6 /100 | #139 | Excellent 11.9% |
| Lebanese | 83.4 /100 | #140 | Excellent 11.9% |
| Immigrants | Morocco | 82.9 /100 | #141 | Excellent 11.9% |
| Immigrants | Zimbabwe | 81.5 /100 | #142 | Excellent 11.9% |
| Pakistanis | 81.3 /100 | #143 | Excellent 11.9% |
| Peruvians | 80.9 /100 | #144 | Excellent 11.9% |
| Croatians | 80.6 /100 | #145 | Excellent 11.9% |
| Immigrants | Grenada | 79.1 /100 | #146 | Good 11.9% |
| Poles | 78.6 /100 | #147 | Good 11.9% |
| Italians | 77.8 /100 | #148 | Good 11.9% |
| Immigrants | Oceania | 77.7 /100 | #149 | Good 11.9% |
| Immigrants | Portugal | 77.3 /100 | #150 | Good 11.9% |