Native Hawaiian vs Immigrants from Nicaragua Currently Married
COMPARE
Native Hawaiian
Immigrants from Nicaragua
Currently Married
Currently Married Comparison
Native Hawaiians
Immigrants from Nicaragua
47.9%
CURRENTLY MARRIED
95.0/ 100
METRIC RATING
94th/ 347
METRIC RANK
43.7%
CURRENTLY MARRIED
0.1/ 100
METRIC RATING
261st/ 347
METRIC RANK
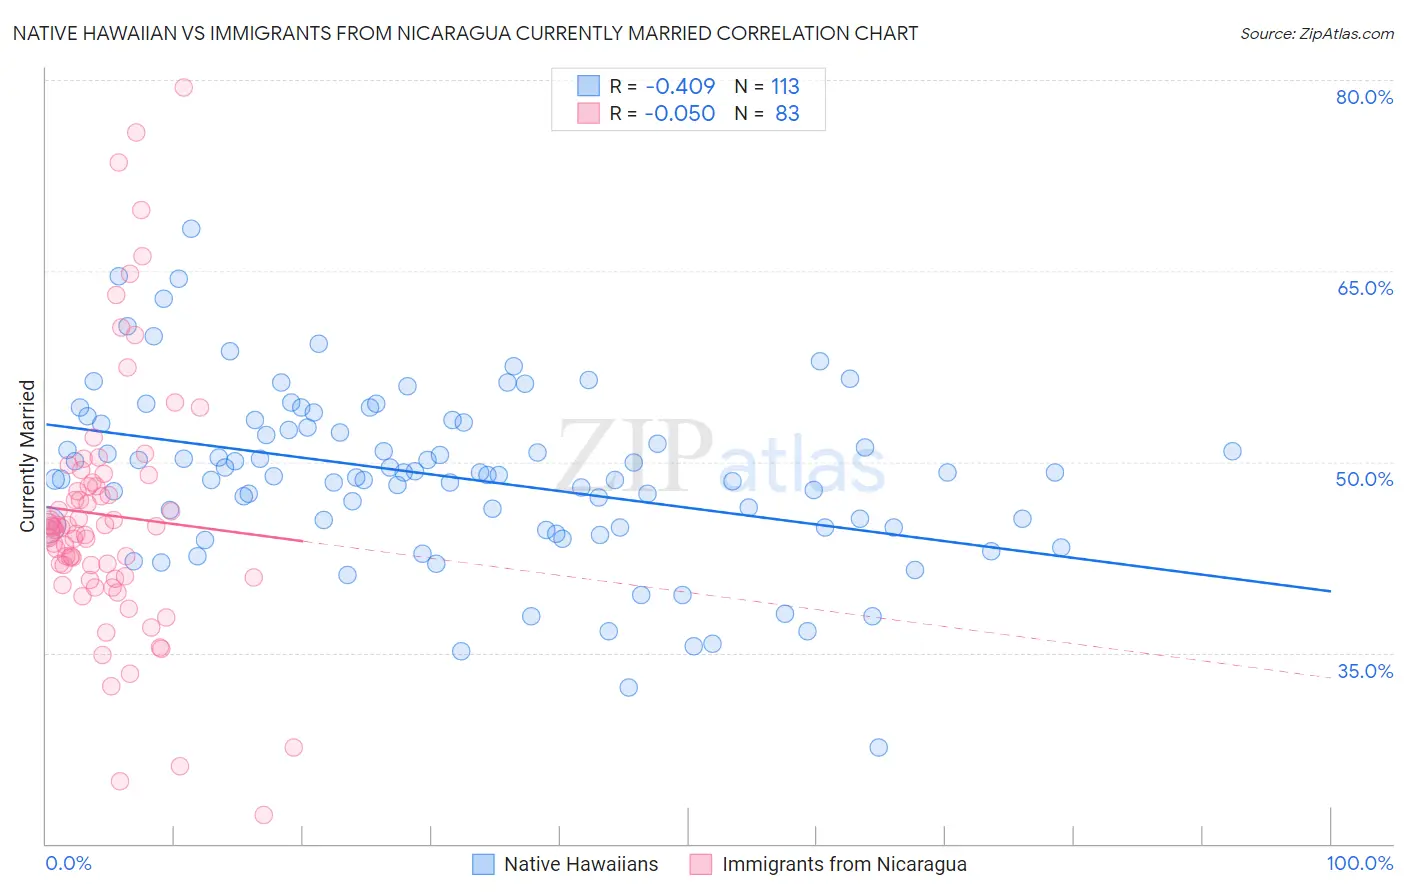
Native Hawaiian vs Immigrants from Nicaragua Currently Married Correlation Chart
The statistical analysis conducted on geographies consisting of 332,071,808 people shows a moderate negative correlation between the proportion of Native Hawaiians and percentage of population currently married in the United States with a correlation coefficient (R) of -0.409 and weighted average of 47.9%. Similarly, the statistical analysis conducted on geographies consisting of 236,341,700 people shows a slight negative correlation between the proportion of Immigrants from Nicaragua and percentage of population currently married in the United States with a correlation coefficient (R) of -0.050 and weighted average of 43.7%, a difference of 9.5%.
Currently Married Correlation Summary
| Measurement | Native Hawaiian | Immigrants from Nicaragua |
| Minimum | 27.6% | 22.3% |
| Maximum | 68.3% | 79.4% |
| Range | 40.7% | 57.1% |
| Mean | 48.8% | 45.8% |
| Median | 49.0% | 44.9% |
| Interquartile 25% (IQ1) | 44.8% | 40.9% |
| Interquartile 75% (IQ3) | 53.0% | 48.4% |
| Interquartile Range (IQR) | 8.2% | 7.5% |
| Standard Deviation (Sample) | 6.8% | 10.1% |
| Standard Deviation (Population) | 6.8% | 10.1% |
Similar Demographics by Currently Married
Demographics Similar to Native Hawaiians by Currently Married
In terms of currently married, the demographic groups most similar to Native Hawaiians are Lebanese (47.9%, a difference of 0.010%), Immigrants from Bulgaria (47.9%, a difference of 0.040%), Egyptian (47.9%, a difference of 0.040%), Immigrants from Ukraine (47.9%, a difference of 0.040%), and Immigrants from China (47.9%, a difference of 0.060%).
| Demographics | Rating | Rank | Currently Married |
| Jordanians | 96.2 /100 | #87 | Exceptional 48.0% |
| Immigrants | Eastern Europe | 96.1 /100 | #88 | Exceptional 48.0% |
| Indians (Asian) | 95.8 /100 | #89 | Exceptional 48.0% |
| Americans | 95.7 /100 | #90 | Exceptional 48.0% |
| Immigrants | Bolivia | 95.6 /100 | #91 | Exceptional 47.9% |
| Koreans | 95.4 /100 | #92 | Exceptional 47.9% |
| Lebanese | 95.1 /100 | #93 | Exceptional 47.9% |
| Native Hawaiians | 95.0 /100 | #94 | Exceptional 47.9% |
| Immigrants | Bulgaria | 94.8 /100 | #95 | Exceptional 47.9% |
| Egyptians | 94.8 /100 | #96 | Exceptional 47.9% |
| Immigrants | Ukraine | 94.8 /100 | #97 | Exceptional 47.9% |
| Immigrants | China | 94.7 /100 | #98 | Exceptional 47.9% |
| Immigrants | Sweden | 94.3 /100 | #99 | Exceptional 47.8% |
| Celtics | 94.2 /100 | #100 | Exceptional 47.8% |
| Immigrants | Germany | 94.1 /100 | #101 | Exceptional 47.8% |
Demographics Similar to Immigrants from Nicaragua by Currently Married
In terms of currently married, the demographic groups most similar to Immigrants from Nicaragua are Immigrants from Latin America (43.8%, a difference of 0.040%), Immigrants from Sierra Leone (43.8%, a difference of 0.11%), Bangladeshi (43.7%, a difference of 0.14%), Immigrants from Cuba (43.7%, a difference of 0.18%), and Sudanese (43.7%, a difference of 0.19%).
| Demographics | Rating | Rank | Currently Married |
| Vietnamese | 0.2 /100 | #254 | Tragic 44.0% |
| Yakama | 0.2 /100 | #255 | Tragic 44.0% |
| Shoshone | 0.2 /100 | #256 | Tragic 44.0% |
| Immigrants | Africa | 0.2 /100 | #257 | Tragic 43.9% |
| Ute | 0.2 /100 | #258 | Tragic 43.9% |
| Immigrants | Sierra Leone | 0.1 /100 | #259 | Tragic 43.8% |
| Immigrants | Latin America | 0.1 /100 | #260 | Tragic 43.8% |
| Immigrants | Nicaragua | 0.1 /100 | #261 | Tragic 43.7% |
| Bangladeshis | 0.1 /100 | #262 | Tragic 43.7% |
| Immigrants | Cuba | 0.1 /100 | #263 | Tragic 43.7% |
| Sudanese | 0.1 /100 | #264 | Tragic 43.7% |
| Immigrants | Bangladesh | 0.1 /100 | #265 | Tragic 43.6% |
| Ecuadorians | 0.1 /100 | #266 | Tragic 43.6% |
| Immigrants | Eritrea | 0.1 /100 | #267 | Tragic 43.6% |
| Spanish American Indians | 0.1 /100 | #268 | Tragic 43.6% |