Native Hawaiian vs Immigrants from Nicaragua Householder Income Ages 45 - 64 years

COMPARE

Native Hawaiian
Race
Ancestry
AfghanAfricanAlaska NativeAlaskan AthabascanAlbanianAleutAlsatianAmericanApacheArabArapahoArgentineanArmenianAssyrian/Chaldean/SyriacAustralianAustrianBahamianBangladeshiBarbadianBasqueBelgianBelizeanBermudanBhutaneseBlackfeetBolivianBrazilianBritishBritish West IndianBulgarianBurmeseCajunCambodianCanadianCape VerdeanCarpatho RusynCelticCentral AmericanCentral American IndianCherokeeCheyenneChickasawChileanChineseChippewaChoctawColombianColvilleComancheCosta RicanCreeCreekCroatianCrowCubanCypriotCzechCzechoslovakianDanishDelawareDominicanDutchDutch West IndianEastern EuropeanEcuadorianEgyptianEnglishEstonianEthiopianEuropeanFijianFilipinoFinnishFrenchFrench American IndianFrench CanadianGermanGerman RussianGhanaianGreekGuamanian/ChamorroGuatemalanGuyaneseHaitianHmongHonduranHopiHoumaHungarianIcelanderIndian (Asian)IndonesianInupiatIranianIraqiIrishIroquoisIsraeliItalianJamaicanJapaneseJordanianKenyanKiowaKoreanLaotianLatvianLebaneseLiberianLithuanianLumbeeLuxembourgerMacedonianMalaysianMalteseMarshalleseMenomineeMexicanMexican American IndianMongolianMoroccanNative HawaiianNavajoNepaleseNew ZealanderNicaraguanNigerianNorthern EuropeanNorwegianOkinawanOsageOttawaPaiutePakistaniPalestinianPanamanianParaguayanPennsylvania GermanPeruvianPimaPolishPortuguesePotawatomiPuebloPuerto RicanPuget Sound SalishRomanianRussianSalvadoranSamoanScandinavianScotch-IrishScottishSeminoleSenegaleseSerbianShoshoneSierra LeoneanSiouxSlavicSlovakSloveneSomaliSouth AfricanSouth AmericanSouth American IndianSoviet UnionSpaniardSpanishSpanish AmericanSpanish American IndianSri LankanSubsaharan AfricanSudaneseSwedishSwissSyrianTaiwaneseThaiTlingit-HaidaTohono O'OdhamTonganTrinidadian and TobagonianTsimshianTurkishU.S. Virgin IslanderUgandanUkrainianUruguayanUteVenezuelanVietnameseWelshWest IndianYakamaYaquiYugoslavianYumanYup'ikZimbabwean
Immigration
NonimmigrantsImmigrantsAfghanistanAfricaAlbaniaArgentinaArmeniaAsiaAustraliaAustriaBahamasBangladeshBarbadosBelarusBelgiumBelizeBoliviaBosnia and HerzegovinaBrazilBulgariaBurma/MyanmarCabo VerdeCambodiaCameroonCanadaCaribbeanCentral AmericaChileChinaColombiaCongoCosta RicaCroatiaCubaCzechoslovakiaDenmarkDominicaDominican RepublicEastern AfricaEastern AsiaEastern EuropeEcuadorEgyptEl SalvadorEnglandEritreaEthiopiaEuropeFijiFranceGermanyGhanaGreeceGrenadaGuatemalaGuyanaHaitiHondurasHong KongHungaryIndiaIndonesiaIranIraqIrelandIsraelItalyJamaicaJapanJordanKazakhstanKenyaKoreaKuwaitLaosLatin AmericaLatviaLebanonLiberiaLithuaniaMalaysiaMexicoMicronesiaMiddle AfricaMoldovaMoroccoNepalNetherlandsNigeriaNorth AmericaNorth MacedoniaNorthern AfricaNorthern EuropeNorwayOceaniaPakistanPanamaPeruPhilippinesPolandPortugalRomaniaRussiaSaudi ArabiaScotlandSenegalSerbiaSierra LeoneSingaporeSomaliaSouth AfricaSouth AmericaSouth Central AsiaSouth Eastern AsiaSouthern EuropeSpainSri LankaSt. Vincent and the GrenadinesSudanSwedenSwitzerlandSyriaTaiwanThailandTrinidad and TobagoTurkeyUgandaUkraineUruguayUzbekistanVenezuelaVietnamWest IndiesWestern AfricaWestern AsiaWestern EuropeYemenZaireZimbabweAzores
Immigrants from Nicaragua
Race
Ancestry
AfghanAfricanAlaska NativeAlaskan AthabascanAlbanianAleutAlsatianAmericanApacheArabArapahoArgentineanArmenianAssyrian/Chaldean/SyriacAustralianAustrianBahamianBangladeshiBarbadianBasqueBelgianBelizeanBermudanBhutaneseBlackfeetBolivianBrazilianBritishBritish West IndianBulgarianBurmeseCajunCambodianCanadianCape VerdeanCarpatho RusynCelticCentral AmericanCentral American IndianCherokeeCheyenneChickasawChileanChineseChippewaChoctawColombianColvilleComancheCosta RicanCreeCreekCroatianCrowCubanCypriotCzechCzechoslovakianDanishDelawareDominicanDutchDutch West IndianEastern EuropeanEcuadorianEgyptianEnglishEstonianEthiopianEuropeanFijianFilipinoFinnishFrenchFrench American IndianFrench CanadianGermanGerman RussianGhanaianGreekGuamanian/ChamorroGuatemalanGuyaneseHaitianHmongHonduranHopiHoumaHungarianIcelanderIndian (Asian)IndonesianInupiatIranianIraqiIrishIroquoisIsraeliItalianJamaicanJapaneseJordanianKenyanKiowaKoreanLaotianLatvianLebaneseLiberianLithuanianLumbeeLuxembourgerMacedonianMalaysianMalteseMarshalleseMenomineeMexicanMexican American IndianMongolianMoroccanNavajoNepaleseNew ZealanderNicaraguanNigerianNorthern EuropeanNorwegianOkinawanOsageOttawaPaiutePakistaniPalestinianPanamanianParaguayanPennsylvania GermanPeruvianPimaPolishPortuguesePotawatomiPuebloPuerto RicanPuget Sound SalishRomanianRussianSalvadoranSamoanScandinavianScotch-IrishScottishSeminoleSenegaleseSerbianShoshoneSierra LeoneanSiouxSlavicSlovakSloveneSomaliSouth AfricanSouth AmericanSouth American IndianSoviet UnionSpaniardSpanishSpanish AmericanSpanish American IndianSri LankanSubsaharan AfricanSudaneseSwedishSwissSyrianTaiwaneseThaiTlingit-HaidaTohono O'OdhamTonganTrinidadian and TobagonianTsimshianTurkishU.S. Virgin IslanderUgandanUkrainianUruguayanUteVenezuelanVietnameseWelshWest IndianYakamaYaquiYugoslavianYumanYup'ikZimbabwean
Immigration
NonimmigrantsImmigrantsAfghanistanAfricaAlbaniaArgentinaArmeniaAsiaAustraliaAustriaBahamasBangladeshBarbadosBelarusBelgiumBelizeBoliviaBosnia and HerzegovinaBrazilBulgariaBurma/MyanmarCabo VerdeCambodiaCameroonCanadaCaribbeanCentral AmericaChileChinaColombiaCongoCosta RicaCroatiaCubaCzechoslovakiaDenmarkDominicaDominican RepublicEastern AfricaEastern AsiaEastern EuropeEcuadorEgyptEl SalvadorEnglandEritreaEthiopiaEuropeFijiFranceGermanyGhanaGreeceGrenadaGuatemalaGuyanaHaitiHondurasHong KongHungaryIndiaIndonesiaIranIraqIrelandIsraelItalyJamaicaJapanJordanKazakhstanKenyaKoreaKuwaitLaosLatin AmericaLatviaLebanonLiberiaLithuaniaMalaysiaMexicoMicronesiaMiddle AfricaMoldovaMoroccoNepalNetherlandsNicaraguaNigeriaNorth AmericaNorth MacedoniaNorthern AfricaNorthern EuropeNorwayOceaniaPakistanPanamaPeruPhilippinesPolandPortugalRomaniaRussiaSaudi ArabiaScotlandSenegalSerbiaSierra LeoneSingaporeSomaliaSouth AfricaSouth AmericaSouth Central AsiaSouth Eastern AsiaSouthern EuropeSpainSri LankaSt. Vincent and the GrenadinesSudanSwedenSwitzerlandSyriaTaiwanThailandTrinidad and TobagoTurkeyUgandaUkraineUruguayUzbekistanVenezuelaVietnamWest IndiesWestern AfricaWestern AsiaWestern EuropeYemenZaireZimbabweAzores
Householder Income Ages 45 - 64 years
Income
Poverty
Unemployment
Labor Participation
Family Structure
Vehicle Availability
Education Level
Disability

Householder Income Ages 45 - 64 years Comparison

Native Hawaiians

Immigrants from Nicaragua

Exceptional
Tragic
$105,149
HOUSEHOLDER INCOME AGES 45 - 64 YEARS
91.8/ 100
METRIC RATING
128th/ 347
METRIC RANK
$89,108
HOUSEHOLDER INCOME AGES 45 - 64 YEARS
0.4/ 100
METRIC RATING
259th/ 347
METRIC RANK

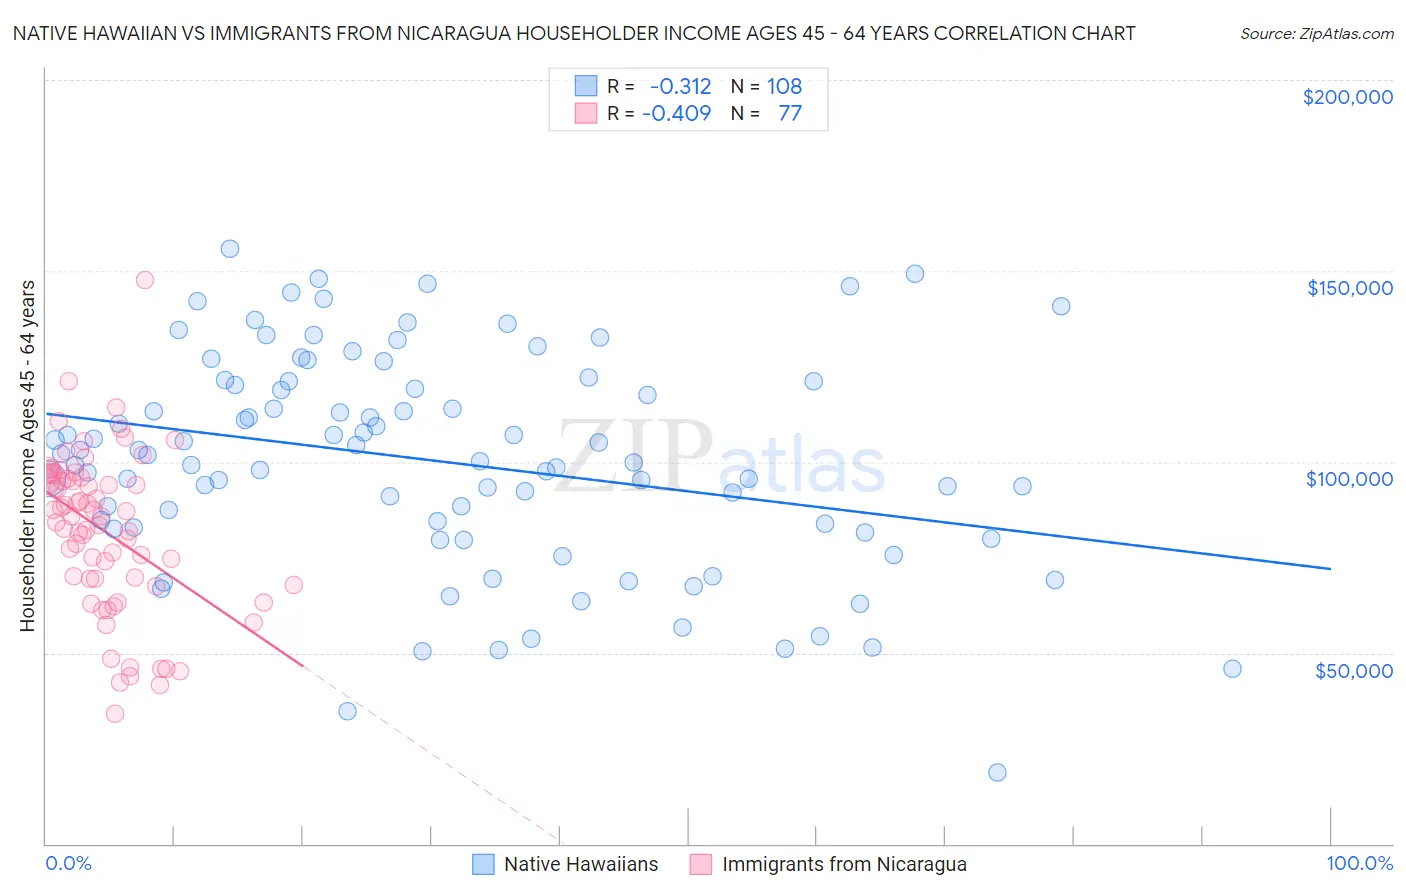
Native Hawaiian vs Immigrants from Nicaragua Householder Income Ages 45 - 64 years Correlation Chart

The statistical analysis conducted on geographies consisting of 331,465,434 people shows a mild negative correlation between the proportion of Native Hawaiians and household income with householder between the ages 45 and 64 in the United States with a correlation coefficient (R) of -0.312 and weighted average of $105,149. Similarly, the statistical analysis conducted on geographies consisting of 236,224,190 people shows a moderate negative correlation between the proportion of Immigrants from Nicaragua and household income with householder between the ages 45 and 64 in the United States with a correlation coefficient (R) of -0.409 and weighted average of $89,108, a difference of 18.0%.
Native Hawaiian vs Immigrants from Nicaragua Householder Income Ages 45 - 64 years

Householder Income Ages 45 - 64 years Correlation Summary

MeasurementNative HawaiianImmigrants from Nicaragua
Minimum$18,640$33,906
Maximum$155,705$147,500
Range$137,065$113,594
Mean$100,121$81,875
Median$101,051$85,711
Interquartile 25% (IQ1)$82,658$68,574
Interquartile 75% (IQ3)$120,563$95,783
Interquartile Range (IQR)$37,905$27,209
Standard Deviation (Sample)$28,044$20,905
Standard Deviation (Population)$27,914$20,769

Similar Demographics by Householder Income Ages 45 - 64 years

Demographics Similar to Native Hawaiians by Householder Income Ages 45 - 64 years

In terms of householder income ages 45 - 64 years, the demographic groups most similar to Native Hawaiians are Peruvian ($105,070, a difference of 0.080%), Immigrants from Saudi Arabia ($105,249, a difference of 0.090%), Portuguese ($105,309, a difference of 0.15%), Immigrants from Zimbabwe ($104,992, a difference of 0.15%), and Pakistani ($105,317, a difference of 0.16%).
DemographicsRating | RankHouseholder Income Ages 45 - 64 years
Poles
94.4
/100
|
#121
Exceptional
$105,952
Immigrants | North Macedonia
94.2
/100
|
#122
Exceptional
$105,892
Danes
93.4
/100
|
#123
Exceptional
$105,619
Immigrants | Northern Africa
92.8
/100
|
#124
Exceptional
$105,430
Pakistanis
92.4
/100
|
#125
Exceptional
$105,317
Portuguese
92.4
/100
|
#126
Exceptional
$105,309
Immigrants | Saudi Arabia
92.2
/100
|
#127
Exceptional
$105,249
Native Hawaiians
91.8
/100
|
#128
Exceptional
$105,149
Peruvians
91.5
/100
|
#129
Exceptional
$105,070
Immigrants | Zimbabwe
91.2
/100
|
#130
Exceptional
$104,992
Immigrants | Syria
90.7
/100
|
#131
Exceptional
$104,858
Lebanese
90.1
/100
|
#132
Exceptional
$104,734
Arabs
89.3
/100
|
#133
Excellent
$104,566
Canadians
89.3
/100
|
#134
Excellent
$104,560
Brazilians
88.6
/100
|
#135
Excellent
$104,408

Demographics Similar to Immigrants from Nicaragua by Householder Income Ages 45 - 64 years

In terms of householder income ages 45 - 64 years, the demographic groups most similar to Immigrants from Nicaragua are Liberian ($88,929, a difference of 0.20%), Immigrants from Barbados ($89,394, a difference of 0.32%), German Russian ($89,398, a difference of 0.33%), Belizean ($88,684, a difference of 0.48%), and Somali ($88,600, a difference of 0.57%).
DemographicsRating | RankHouseholder Income Ages 45 - 64 years
Marshallese
0.7
/100
|
#252
Tragic
$90,455
Barbadians
0.6
/100
|
#253
Tragic
$90,266
Immigrants | Guyana
0.6
/100
|
#254
Tragic
$90,186
West Indians
0.5
/100
|
#255
Tragic
$89,906
French American Indians
0.5
/100
|
#256
Tragic
$89,811
German Russians
0.4
/100
|
#257
Tragic
$89,398
Immigrants | Barbados
0.4
/100
|
#258
Tragic
$89,394
Immigrants | Nicaragua
0.4
/100
|
#259
Tragic
$89,108
Liberians
0.3
/100
|
#260
Tragic
$88,929
Belizeans
0.3
/100
|
#261
Tragic
$88,684
Somalis
0.3
/100
|
#262
Tragic
$88,600
Immigrants | Senegal
0.3
/100
|
#263
Tragic
$88,421
Osage
0.3
/100
|
#264
Tragic
$88,390
Jamaicans
0.2
/100
|
#265
Tragic
$88,327
Immigrants | West Indies
0.2
/100
|
#266
Tragic
$88,164