Ugandan vs Immigrants from Nicaragua Currently Married
COMPARE
Ugandan
Immigrants from Nicaragua
Currently Married
Currently Married Comparison
Ugandans
Immigrants from Nicaragua
44.2%
CURRENTLY MARRIED
0.4/ 100
METRIC RATING
247th/ 347
METRIC RANK
43.7%
CURRENTLY MARRIED
0.1/ 100
METRIC RATING
261st/ 347
METRIC RANK
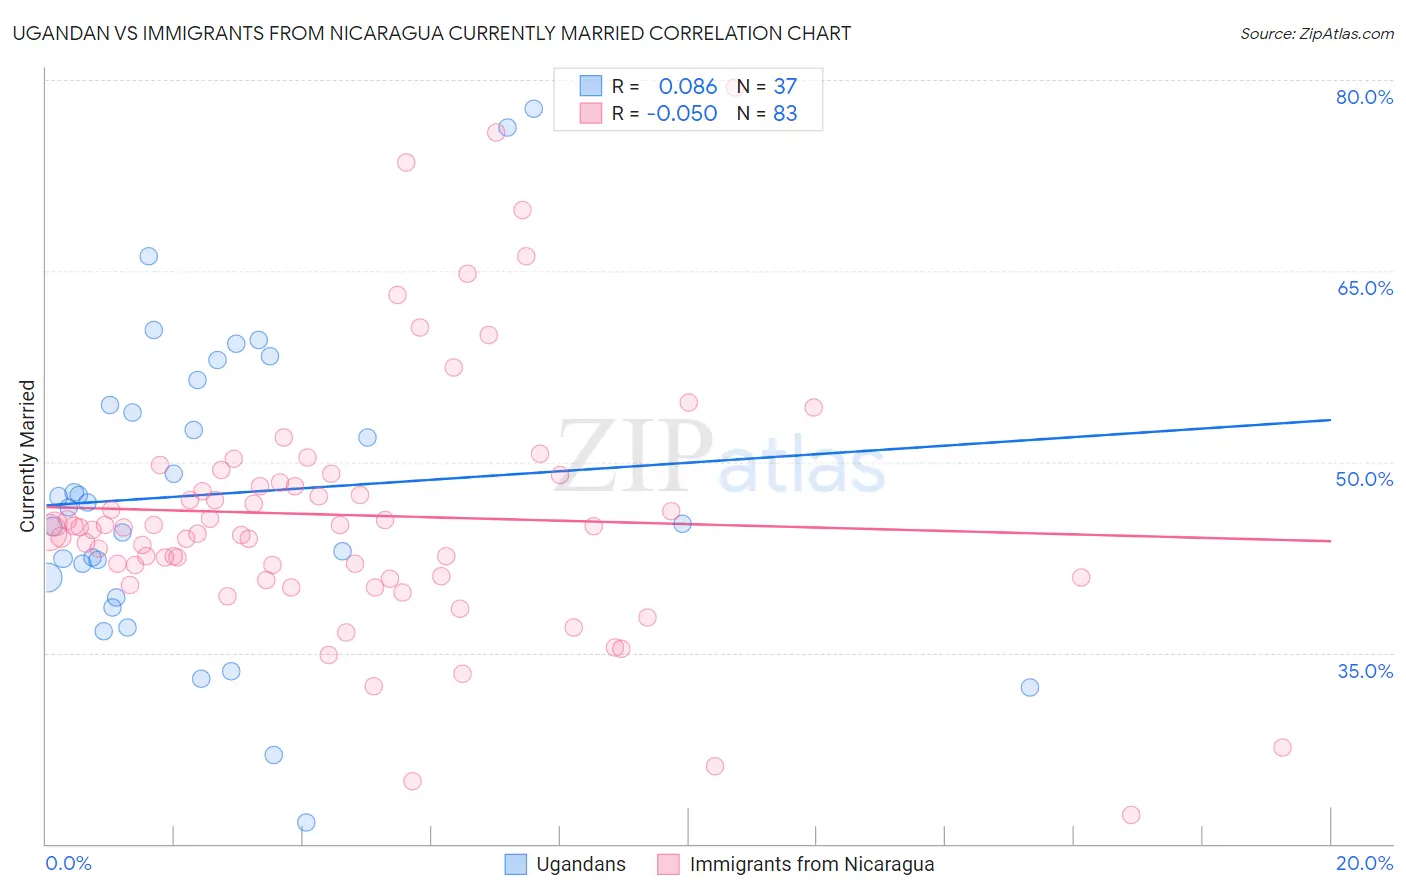
Ugandan vs Immigrants from Nicaragua Currently Married Correlation Chart
The statistical analysis conducted on geographies consisting of 94,016,399 people shows a slight positive correlation between the proportion of Ugandans and percentage of population currently married in the United States with a correlation coefficient (R) of 0.086 and weighted average of 44.2%. Similarly, the statistical analysis conducted on geographies consisting of 236,341,700 people shows a slight negative correlation between the proportion of Immigrants from Nicaragua and percentage of population currently married in the United States with a correlation coefficient (R) of -0.050 and weighted average of 43.7%, a difference of 1.1%.
Currently Married Correlation Summary
| Measurement | Ugandan | Immigrants from Nicaragua |
| Minimum | 21.7% | 22.3% |
| Maximum | 77.7% | 79.4% |
| Range | 56.0% | 57.1% |
| Mean | 47.5% | 45.8% |
| Median | 46.4% | 44.9% |
| Interquartile 25% (IQ1) | 40.1% | 40.9% |
| Interquartile 75% (IQ3) | 55.4% | 48.4% |
| Interquartile Range (IQR) | 15.3% | 7.5% |
| Standard Deviation (Sample) | 12.1% | 10.1% |
| Standard Deviation (Population) | 11.9% | 10.1% |
Demographics Similar to Ugandans and Immigrants from Nicaragua by Currently Married
In terms of currently married, the demographic groups most similar to Ugandans are Nicaraguan (44.2%, a difference of 0.090%), Immigrants from Cameroon (44.2%, a difference of 0.10%), Immigrants from Eastern Africa (44.2%, a difference of 0.12%), Immigrants from Burma/Myanmar (44.3%, a difference of 0.13%), and Blackfeet (44.2%, a difference of 0.19%). Similarly, the demographic groups most similar to Immigrants from Nicaragua are Immigrants from Latin America (43.8%, a difference of 0.040%), Immigrants from Sierra Leone (43.8%, a difference of 0.11%), Bangladeshi (43.7%, a difference of 0.14%), Immigrants from Cuba (43.7%, a difference of 0.18%), and Sudanese (43.7%, a difference of 0.19%).
| Demographics | Rating | Rank | Currently Married |
| Japanese | 0.6 /100 | #244 | Tragic 44.5% |
| Immigrants | Armenia | 0.4 /100 | #245 | Tragic 44.3% |
| Immigrants | Burma/Myanmar | 0.4 /100 | #246 | Tragic 44.3% |
| Ugandans | 0.4 /100 | #247 | Tragic 44.2% |
| Nicaraguans | 0.3 /100 | #248 | Tragic 44.2% |
| Immigrants | Cameroon | 0.3 /100 | #249 | Tragic 44.2% |
| Immigrants | Eastern Africa | 0.3 /100 | #250 | Tragic 44.2% |
| Blackfeet | 0.3 /100 | #251 | Tragic 44.2% |
| Hispanics or Latinos | 0.3 /100 | #252 | Tragic 44.1% |
| Immigrants | Central America | 0.3 /100 | #253 | Tragic 44.1% |
| Vietnamese | 0.2 /100 | #254 | Tragic 44.0% |
| Yakama | 0.2 /100 | #255 | Tragic 44.0% |
| Shoshone | 0.2 /100 | #256 | Tragic 44.0% |
| Immigrants | Africa | 0.2 /100 | #257 | Tragic 43.9% |
| Ute | 0.2 /100 | #258 | Tragic 43.9% |
| Immigrants | Sierra Leone | 0.1 /100 | #259 | Tragic 43.8% |
| Immigrants | Latin America | 0.1 /100 | #260 | Tragic 43.8% |
| Immigrants | Nicaragua | 0.1 /100 | #261 | Tragic 43.7% |
| Bangladeshis | 0.1 /100 | #262 | Tragic 43.7% |
| Immigrants | Cuba | 0.1 /100 | #263 | Tragic 43.7% |
| Sudanese | 0.1 /100 | #264 | Tragic 43.7% |