Native Hawaiian vs Immigrants from Portugal Currently Married
COMPARE
Native Hawaiian
Immigrants from Portugal
Currently Married
Currently Married Comparison
Native Hawaiians
Immigrants from Portugal
47.9%
CURRENTLY MARRIED
95.0/ 100
METRIC RATING
94th/ 347
METRIC RANK
45.2%
CURRENTLY MARRIED
3.5/ 100
METRIC RATING
219th/ 347
METRIC RANK
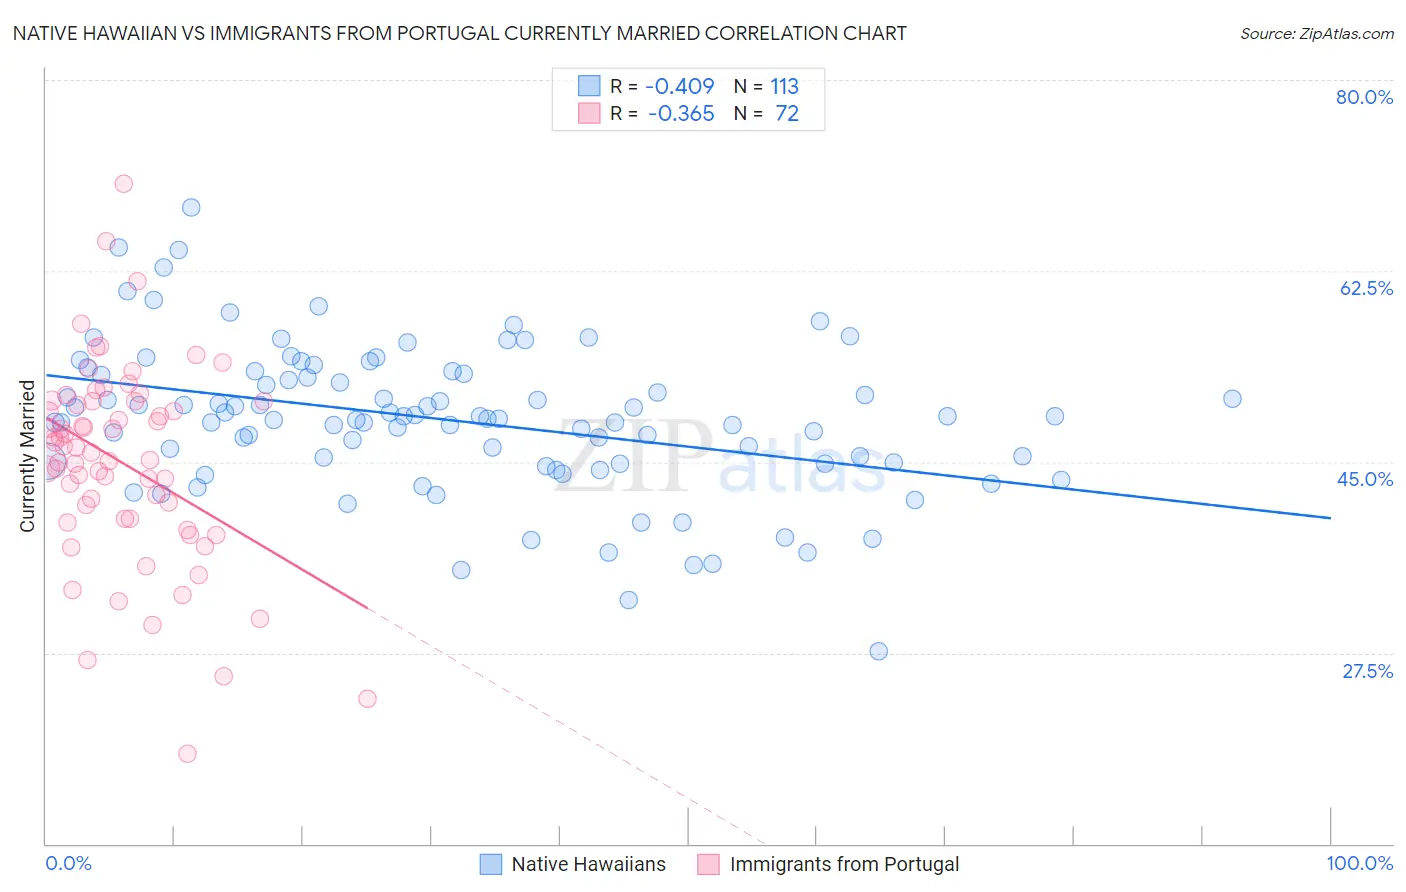
Native Hawaiian vs Immigrants from Portugal Currently Married Correlation Chart
The statistical analysis conducted on geographies consisting of 332,071,808 people shows a moderate negative correlation between the proportion of Native Hawaiians and percentage of population currently married in the United States with a correlation coefficient (R) of -0.409 and weighted average of 47.9%. Similarly, the statistical analysis conducted on geographies consisting of 174,784,868 people shows a mild negative correlation between the proportion of Immigrants from Portugal and percentage of population currently married in the United States with a correlation coefficient (R) of -0.365 and weighted average of 45.2%, a difference of 5.9%.
Currently Married Correlation Summary
| Measurement | Native Hawaiian | Immigrants from Portugal |
| Minimum | 27.6% | 18.3% |
| Maximum | 68.3% | 70.5% |
| Range | 40.7% | 52.2% |
| Mean | 48.8% | 44.9% |
| Median | 49.0% | 46.1% |
| Interquartile 25% (IQ1) | 44.8% | 39.8% |
| Interquartile 75% (IQ3) | 53.0% | 50.5% |
| Interquartile Range (IQR) | 8.2% | 10.8% |
| Standard Deviation (Sample) | 6.8% | 9.1% |
| Standard Deviation (Population) | 6.8% | 9.1% |
Similar Demographics by Currently Married
Demographics Similar to Native Hawaiians by Currently Married
In terms of currently married, the demographic groups most similar to Native Hawaiians are Lebanese (47.9%, a difference of 0.010%), Immigrants from Bulgaria (47.9%, a difference of 0.040%), Egyptian (47.9%, a difference of 0.040%), Immigrants from Ukraine (47.9%, a difference of 0.040%), and Immigrants from China (47.9%, a difference of 0.060%).
| Demographics | Rating | Rank | Currently Married |
| Jordanians | 96.2 /100 | #87 | Exceptional 48.0% |
| Immigrants | Eastern Europe | 96.1 /100 | #88 | Exceptional 48.0% |
| Indians (Asian) | 95.8 /100 | #89 | Exceptional 48.0% |
| Americans | 95.7 /100 | #90 | Exceptional 48.0% |
| Immigrants | Bolivia | 95.6 /100 | #91 | Exceptional 47.9% |
| Koreans | 95.4 /100 | #92 | Exceptional 47.9% |
| Lebanese | 95.1 /100 | #93 | Exceptional 47.9% |
| Native Hawaiians | 95.0 /100 | #94 | Exceptional 47.9% |
| Immigrants | Bulgaria | 94.8 /100 | #95 | Exceptional 47.9% |
| Egyptians | 94.8 /100 | #96 | Exceptional 47.9% |
| Immigrants | Ukraine | 94.8 /100 | #97 | Exceptional 47.9% |
| Immigrants | China | 94.7 /100 | #98 | Exceptional 47.9% |
| Immigrants | Sweden | 94.3 /100 | #99 | Exceptional 47.8% |
| Celtics | 94.2 /100 | #100 | Exceptional 47.8% |
| Immigrants | Germany | 94.1 /100 | #101 | Exceptional 47.8% |
Demographics Similar to Immigrants from Portugal by Currently Married
In terms of currently married, the demographic groups most similar to Immigrants from Portugal are Panamanian (45.3%, a difference of 0.12%), Kenyan (45.2%, a difference of 0.13%), Mexican (45.2%, a difference of 0.14%), Immigrants from the Azores (45.1%, a difference of 0.34%), and Immigrants from Thailand (45.4%, a difference of 0.36%).
| Demographics | Rating | Rank | Currently Married |
| Marshallese | 7.2 /100 | #212 | Tragic 45.5% |
| Alaska Natives | 7.0 /100 | #213 | Tragic 45.5% |
| Dutch West Indians | 6.7 /100 | #214 | Tragic 45.5% |
| German Russians | 6.7 /100 | #215 | Tragic 45.5% |
| Immigrants | Morocco | 5.5 /100 | #216 | Tragic 45.4% |
| Immigrants | Thailand | 5.1 /100 | #217 | Tragic 45.4% |
| Panamanians | 4.0 /100 | #218 | Tragic 45.3% |
| Immigrants | Portugal | 3.5 /100 | #219 | Tragic 45.2% |
| Kenyans | 3.1 /100 | #220 | Tragic 45.2% |
| Mexicans | 3.0 /100 | #221 | Tragic 45.2% |
| Immigrants | Azores | 2.5 /100 | #222 | Tragic 45.1% |
| Immigrants | Laos | 2.3 /100 | #223 | Tragic 45.0% |
| Immigrants | Uganda | 2.2 /100 | #224 | Tragic 45.0% |
| French American Indians | 2.2 /100 | #225 | Tragic 45.0% |
| Comanche | 2.1 /100 | #226 | Tragic 45.0% |