Native Hawaiian vs Immigrants from Ethiopia Currently Married
COMPARE
Native Hawaiian
Immigrants from Ethiopia
Currently Married
Currently Married Comparison
Native Hawaiians
Immigrants from Ethiopia
47.9%
CURRENTLY MARRIED
95.0/ 100
METRIC RATING
94th/ 347
METRIC RANK
44.5%
CURRENTLY MARRIED
0.7/ 100
METRIC RATING
243rd/ 347
METRIC RANK
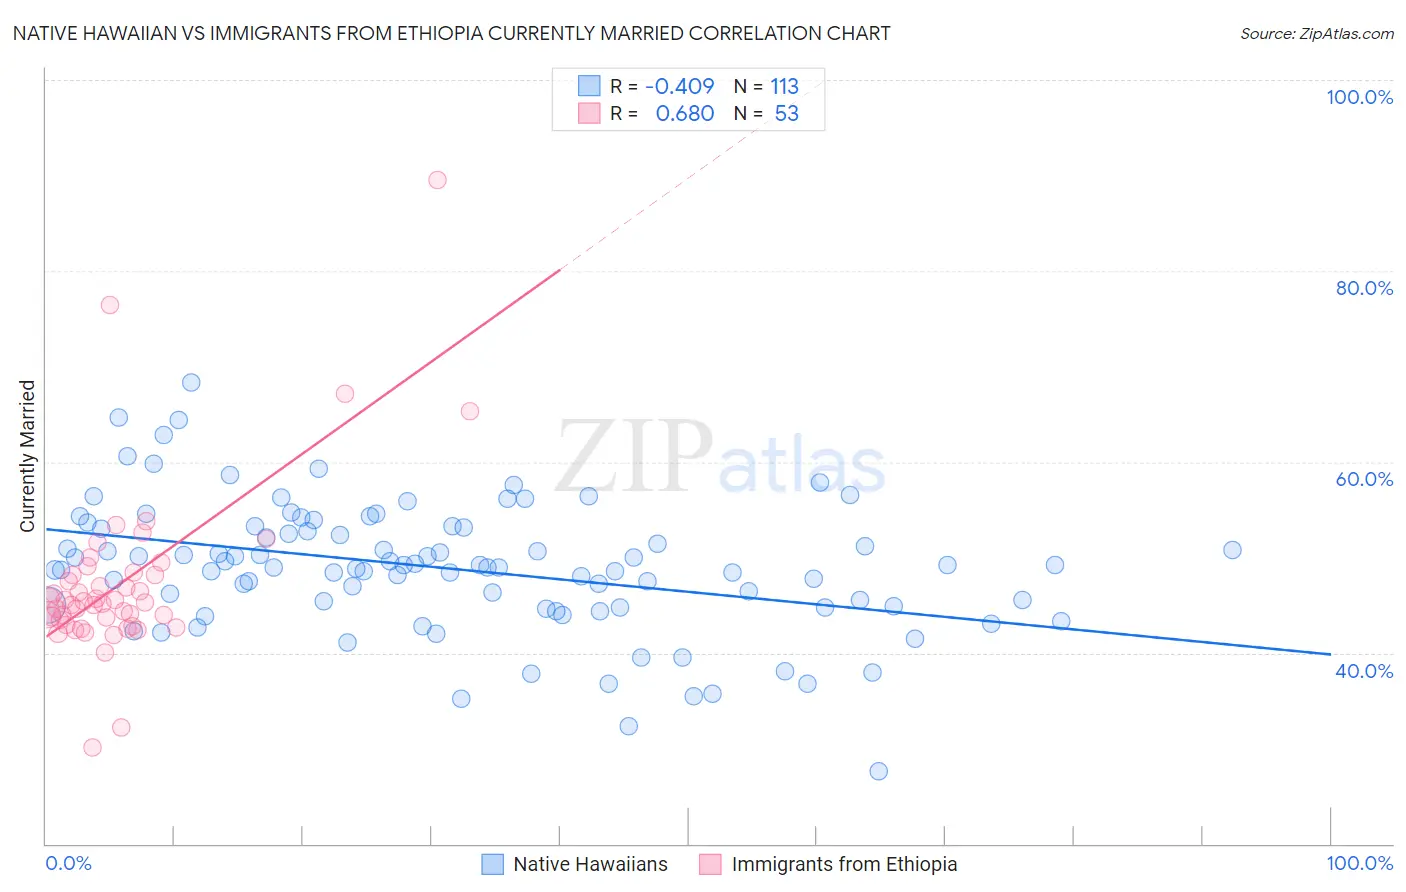
Native Hawaiian vs Immigrants from Ethiopia Currently Married Correlation Chart
The statistical analysis conducted on geographies consisting of 332,071,808 people shows a moderate negative correlation between the proportion of Native Hawaiians and percentage of population currently married in the United States with a correlation coefficient (R) of -0.409 and weighted average of 47.9%. Similarly, the statistical analysis conducted on geographies consisting of 211,554,570 people shows a significant positive correlation between the proportion of Immigrants from Ethiopia and percentage of population currently married in the United States with a correlation coefficient (R) of 0.680 and weighted average of 44.5%, a difference of 7.6%.
Currently Married Correlation Summary
| Measurement | Native Hawaiian | Immigrants from Ethiopia |
| Minimum | 27.6% | 30.1% |
| Maximum | 68.3% | 89.5% |
| Range | 40.7% | 59.4% |
| Mean | 48.8% | 47.4% |
| Median | 49.0% | 45.3% |
| Interquartile 25% (IQ1) | 44.8% | 43.2% |
| Interquartile 75% (IQ3) | 53.0% | 48.3% |
| Interquartile Range (IQR) | 8.2% | 5.0% |
| Standard Deviation (Sample) | 6.8% | 9.3% |
| Standard Deviation (Population) | 6.8% | 9.2% |
Similar Demographics by Currently Married
Demographics Similar to Native Hawaiians by Currently Married
In terms of currently married, the demographic groups most similar to Native Hawaiians are Lebanese (47.9%, a difference of 0.010%), Immigrants from Bulgaria (47.9%, a difference of 0.040%), Egyptian (47.9%, a difference of 0.040%), Immigrants from Ukraine (47.9%, a difference of 0.040%), and Immigrants from China (47.9%, a difference of 0.060%).
| Demographics | Rating | Rank | Currently Married |
| Jordanians | 96.2 /100 | #87 | Exceptional 48.0% |
| Immigrants | Eastern Europe | 96.1 /100 | #88 | Exceptional 48.0% |
| Indians (Asian) | 95.8 /100 | #89 | Exceptional 48.0% |
| Americans | 95.7 /100 | #90 | Exceptional 48.0% |
| Immigrants | Bolivia | 95.6 /100 | #91 | Exceptional 47.9% |
| Koreans | 95.4 /100 | #92 | Exceptional 47.9% |
| Lebanese | 95.1 /100 | #93 | Exceptional 47.9% |
| Native Hawaiians | 95.0 /100 | #94 | Exceptional 47.9% |
| Immigrants | Bulgaria | 94.8 /100 | #95 | Exceptional 47.9% |
| Egyptians | 94.8 /100 | #96 | Exceptional 47.9% |
| Immigrants | Ukraine | 94.8 /100 | #97 | Exceptional 47.9% |
| Immigrants | China | 94.7 /100 | #98 | Exceptional 47.9% |
| Immigrants | Sweden | 94.3 /100 | #99 | Exceptional 47.8% |
| Celtics | 94.2 /100 | #100 | Exceptional 47.8% |
| Immigrants | Germany | 94.1 /100 | #101 | Exceptional 47.8% |
Demographics Similar to Immigrants from Ethiopia by Currently Married
In terms of currently married, the demographic groups most similar to Immigrants from Ethiopia are Immigrants from Cambodia (44.5%, a difference of 0.010%), Ethiopian (44.5%, a difference of 0.040%), Japanese (44.5%, a difference of 0.070%), Immigrants from Mexico (44.5%, a difference of 0.10%), and Mexican American Indian (44.5%, a difference of 0.10%).
| Demographics | Rating | Rank | Currently Married |
| Cubans | 0.9 /100 | #236 | Tragic 44.6% |
| Seminole | 0.9 /100 | #237 | Tragic 44.6% |
| Moroccans | 0.9 /100 | #238 | Tragic 44.6% |
| Immigrants | Mexico | 0.7 /100 | #239 | Tragic 44.5% |
| Mexican American Indians | 0.7 /100 | #240 | Tragic 44.5% |
| Ethiopians | 0.7 /100 | #241 | Tragic 44.5% |
| Immigrants | Cambodia | 0.7 /100 | #242 | Tragic 44.5% |
| Immigrants | Ethiopia | 0.7 /100 | #243 | Tragic 44.5% |
| Japanese | 0.6 /100 | #244 | Tragic 44.5% |
| Immigrants | Armenia | 0.4 /100 | #245 | Tragic 44.3% |
| Immigrants | Burma/Myanmar | 0.4 /100 | #246 | Tragic 44.3% |
| Ugandans | 0.4 /100 | #247 | Tragic 44.2% |
| Nicaraguans | 0.3 /100 | #248 | Tragic 44.2% |
| Immigrants | Cameroon | 0.3 /100 | #249 | Tragic 44.2% |
| Immigrants | Eastern Africa | 0.3 /100 | #250 | Tragic 44.2% |