Moroccan vs Blackfeet Divorced or Separated
COMPARE
Moroccan
Blackfeet
Divorced or Separated
Divorced or Separated Comparison
Moroccans
Blackfeet
12.1%
DIVORCED OR SEPARATED
34.8/ 100
METRIC RATING
190th/ 347
METRIC RANK
13.3%
DIVORCED OR SEPARATED
0.0/ 100
METRIC RATING
312th/ 347
METRIC RANK
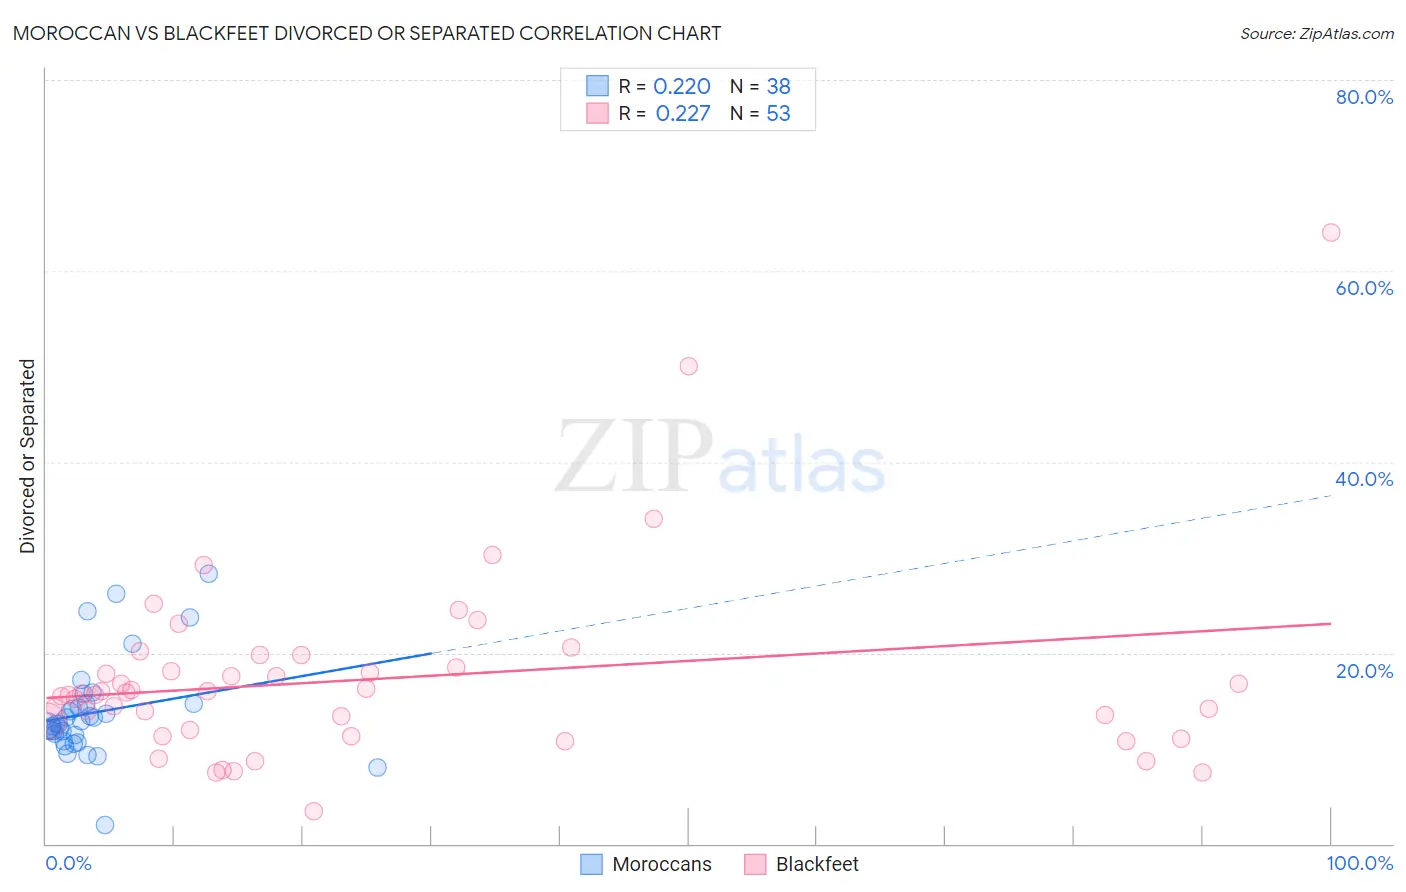
Moroccan vs Blackfeet Divorced or Separated Correlation Chart
The statistical analysis conducted on geographies consisting of 201,776,444 people shows a weak positive correlation between the proportion of Moroccans and percentage of population currently divorced or separated in the United States with a correlation coefficient (R) of 0.220 and weighted average of 12.1%. Similarly, the statistical analysis conducted on geographies consisting of 309,547,647 people shows a weak positive correlation between the proportion of Blackfeet and percentage of population currently divorced or separated in the United States with a correlation coefficient (R) of 0.227 and weighted average of 13.3%, a difference of 9.6%.
Divorced or Separated Correlation Summary
| Measurement | Moroccan | Blackfeet |
| Minimum | 2.0% | 3.4% |
| Maximum | 28.3% | 64.0% |
| Range | 26.3% | 60.6% |
| Mean | 13.7% | 17.3% |
| Median | 12.6% | 15.7% |
| Interquartile 25% (IQ1) | 11.4% | 11.6% |
| Interquartile 75% (IQ3) | 14.6% | 19.1% |
| Interquartile Range (IQR) | 3.2% | 7.6% |
| Standard Deviation (Sample) | 5.1% | 10.0% |
| Standard Deviation (Population) | 5.0% | 9.9% |
Similar Demographics by Divorced or Separated
Demographics Similar to Moroccans by Divorced or Separated
In terms of divorced or separated, the demographic groups most similar to Moroccans are Swedish (12.1%, a difference of 0.020%), Sierra Leonean (12.1%, a difference of 0.030%), Norwegian (12.1%, a difference of 0.060%), Immigrants from Thailand (12.1%, a difference of 0.090%), and Immigrants from Belize (12.1%, a difference of 0.10%).
| Demographics | Rating | Rank | Divorced or Separated |
| Immigrants | Central America | 42.9 /100 | #183 | Average 12.1% |
| Immigrants | North America | 41.1 /100 | #184 | Average 12.1% |
| Immigrants | Nigeria | 40.5 /100 | #185 | Average 12.1% |
| Immigrants | Chile | 39.0 /100 | #186 | Fair 12.1% |
| Belizeans | 37.7 /100 | #187 | Fair 12.1% |
| Immigrants | Belize | 37.6 /100 | #188 | Fair 12.1% |
| Sierra Leoneans | 35.5 /100 | #189 | Fair 12.1% |
| Moroccans | 34.8 /100 | #190 | Fair 12.1% |
| Swedes | 34.4 /100 | #191 | Fair 12.1% |
| Norwegians | 33.2 /100 | #192 | Fair 12.1% |
| Immigrants | Thailand | 32.5 /100 | #193 | Fair 12.1% |
| Immigrants | Eritrea | 31.9 /100 | #194 | Fair 12.1% |
| Immigrants | England | 31.4 /100 | #195 | Fair 12.1% |
| Immigrants | Burma/Myanmar | 30.4 /100 | #196 | Fair 12.1% |
| Immigrants | Africa | 30.3 /100 | #197 | Fair 12.1% |
Demographics Similar to Blackfeet by Divorced or Separated
In terms of divorced or separated, the demographic groups most similar to Blackfeet are Immigrants from Nicaragua (13.3%, a difference of 0.19%), Yaqui (13.3%, a difference of 0.21%), Sioux (13.2%, a difference of 0.35%), African (13.2%, a difference of 0.37%), and American (13.2%, a difference of 0.39%).
| Demographics | Rating | Rank | Divorced or Separated |
| Chippewa | 0.0 /100 | #305 | Tragic 13.2% |
| Tlingit-Haida | 0.0 /100 | #306 | Tragic 13.2% |
| French American Indians | 0.0 /100 | #307 | Tragic 13.2% |
| Ottawa | 0.0 /100 | #308 | Tragic 13.2% |
| Americans | 0.0 /100 | #309 | Tragic 13.2% |
| Africans | 0.0 /100 | #310 | Tragic 13.2% |
| Sioux | 0.0 /100 | #311 | Tragic 13.2% |
| Blackfeet | 0.0 /100 | #312 | Tragic 13.3% |
| Immigrants | Nicaragua | 0.0 /100 | #313 | Tragic 13.3% |
| Yaqui | 0.0 /100 | #314 | Tragic 13.3% |
| Spanish Americans | 0.0 /100 | #315 | Tragic 13.3% |
| Tsimshian | 0.0 /100 | #316 | Tragic 13.3% |
| Haitians | 0.0 /100 | #317 | Tragic 13.3% |
| Cree | 0.0 /100 | #318 | Tragic 13.4% |
| Puget Sound Salish | 0.0 /100 | #319 | Tragic 13.4% |