Moroccan vs Immigrants from Greece Divorced or Separated
COMPARE
Moroccan
Immigrants from Greece
Divorced or Separated
Divorced or Separated Comparison
Moroccans
Immigrants from Greece
12.1%
DIVORCED OR SEPARATED
34.8/ 100
METRIC RATING
190th/ 347
METRIC RANK
11.1%
DIVORCED OR SEPARATED
100.0/ 100
METRIC RATING
38th/ 347
METRIC RANK
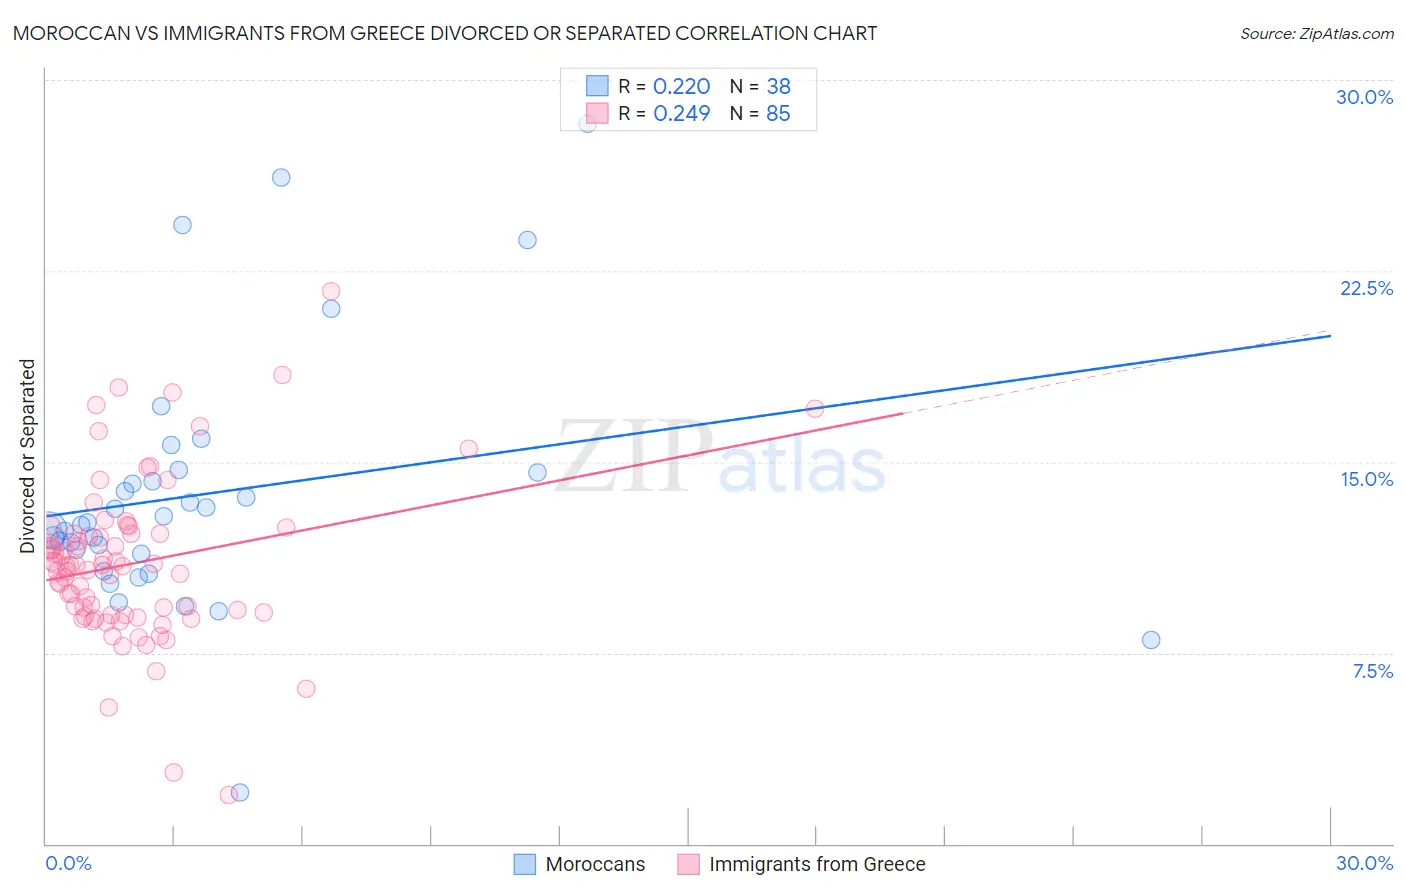
Moroccan vs Immigrants from Greece Divorced or Separated Correlation Chart
The statistical analysis conducted on geographies consisting of 201,776,444 people shows a weak positive correlation between the proportion of Moroccans and percentage of population currently divorced or separated in the United States with a correlation coefficient (R) of 0.220 and weighted average of 12.1%. Similarly, the statistical analysis conducted on geographies consisting of 216,866,276 people shows a weak positive correlation between the proportion of Immigrants from Greece and percentage of population currently divorced or separated in the United States with a correlation coefficient (R) of 0.249 and weighted average of 11.1%, a difference of 9.1%.
Divorced or Separated Correlation Summary
| Measurement | Moroccan | Immigrants from Greece |
| Minimum | 2.0% | 1.9% |
| Maximum | 28.3% | 21.7% |
| Range | 26.3% | 19.8% |
| Mean | 13.7% | 11.0% |
| Median | 12.6% | 10.9% |
| Interquartile 25% (IQ1) | 11.4% | 9.0% |
| Interquartile 75% (IQ3) | 14.6% | 12.2% |
| Interquartile Range (IQR) | 3.2% | 3.2% |
| Standard Deviation (Sample) | 5.1% | 3.2% |
| Standard Deviation (Population) | 5.0% | 3.2% |
Similar Demographics by Divorced or Separated
Demographics Similar to Moroccans by Divorced or Separated
In terms of divorced or separated, the demographic groups most similar to Moroccans are Swedish (12.1%, a difference of 0.020%), Sierra Leonean (12.1%, a difference of 0.030%), Norwegian (12.1%, a difference of 0.060%), Immigrants from Thailand (12.1%, a difference of 0.090%), and Immigrants from Belize (12.1%, a difference of 0.10%).
| Demographics | Rating | Rank | Divorced or Separated |
| Immigrants | Central America | 42.9 /100 | #183 | Average 12.1% |
| Immigrants | North America | 41.1 /100 | #184 | Average 12.1% |
| Immigrants | Nigeria | 40.5 /100 | #185 | Average 12.1% |
| Immigrants | Chile | 39.0 /100 | #186 | Fair 12.1% |
| Belizeans | 37.7 /100 | #187 | Fair 12.1% |
| Immigrants | Belize | 37.6 /100 | #188 | Fair 12.1% |
| Sierra Leoneans | 35.5 /100 | #189 | Fair 12.1% |
| Moroccans | 34.8 /100 | #190 | Fair 12.1% |
| Swedes | 34.4 /100 | #191 | Fair 12.1% |
| Norwegians | 33.2 /100 | #192 | Fair 12.1% |
| Immigrants | Thailand | 32.5 /100 | #193 | Fair 12.1% |
| Immigrants | Eritrea | 31.9 /100 | #194 | Fair 12.1% |
| Immigrants | England | 31.4 /100 | #195 | Fair 12.1% |
| Immigrants | Burma/Myanmar | 30.4 /100 | #196 | Fair 12.1% |
| Immigrants | Africa | 30.3 /100 | #197 | Fair 12.1% |
Demographics Similar to Immigrants from Greece by Divorced or Separated
In terms of divorced or separated, the demographic groups most similar to Immigrants from Greece are Immigrants from Lebanon (11.1%, a difference of 0.060%), Immigrants from Japan (11.1%, a difference of 0.070%), Cambodian (11.1%, a difference of 0.13%), Immigrants from Uzbekistan (11.1%, a difference of 0.21%), and Immigrants from Egypt (11.1%, a difference of 0.24%).
| Demographics | Rating | Rank | Divorced or Separated |
| Mongolians | 100.0 /100 | #31 | Exceptional 11.1% |
| Tongans | 100.0 /100 | #32 | Exceptional 11.1% |
| Egyptians | 100.0 /100 | #33 | Exceptional 11.1% |
| Immigrants | Uzbekistan | 100.0 /100 | #34 | Exceptional 11.1% |
| Cambodians | 100.0 /100 | #35 | Exceptional 11.1% |
| Immigrants | Japan | 100.0 /100 | #36 | Exceptional 11.1% |
| Immigrants | Lebanon | 100.0 /100 | #37 | Exceptional 11.1% |
| Immigrants | Greece | 100.0 /100 | #38 | Exceptional 11.1% |
| Immigrants | Egypt | 100.0 /100 | #39 | Exceptional 11.1% |
| Soviet Union | 100.0 /100 | #40 | Exceptional 11.1% |
| Bhutanese | 100.0 /100 | #41 | Exceptional 11.2% |
| Chinese | 100.0 /100 | #42 | Exceptional 11.2% |
| Immigrants | Belarus | 100.0 /100 | #43 | Exceptional 11.2% |
| Immigrants | Western Asia | 100.0 /100 | #44 | Exceptional 11.2% |
| Turks | 100.0 /100 | #45 | Exceptional 11.2% |