Moroccan vs German Divorced or Separated
COMPARE
Moroccan
German
Divorced or Separated
Divorced or Separated Comparison
Moroccans
Germans
12.1%
DIVORCED OR SEPARATED
34.8/ 100
METRIC RATING
190th/ 347
METRIC RANK
12.5%
DIVORCED OR SEPARATED
1.8/ 100
METRIC RATING
247th/ 347
METRIC RANK
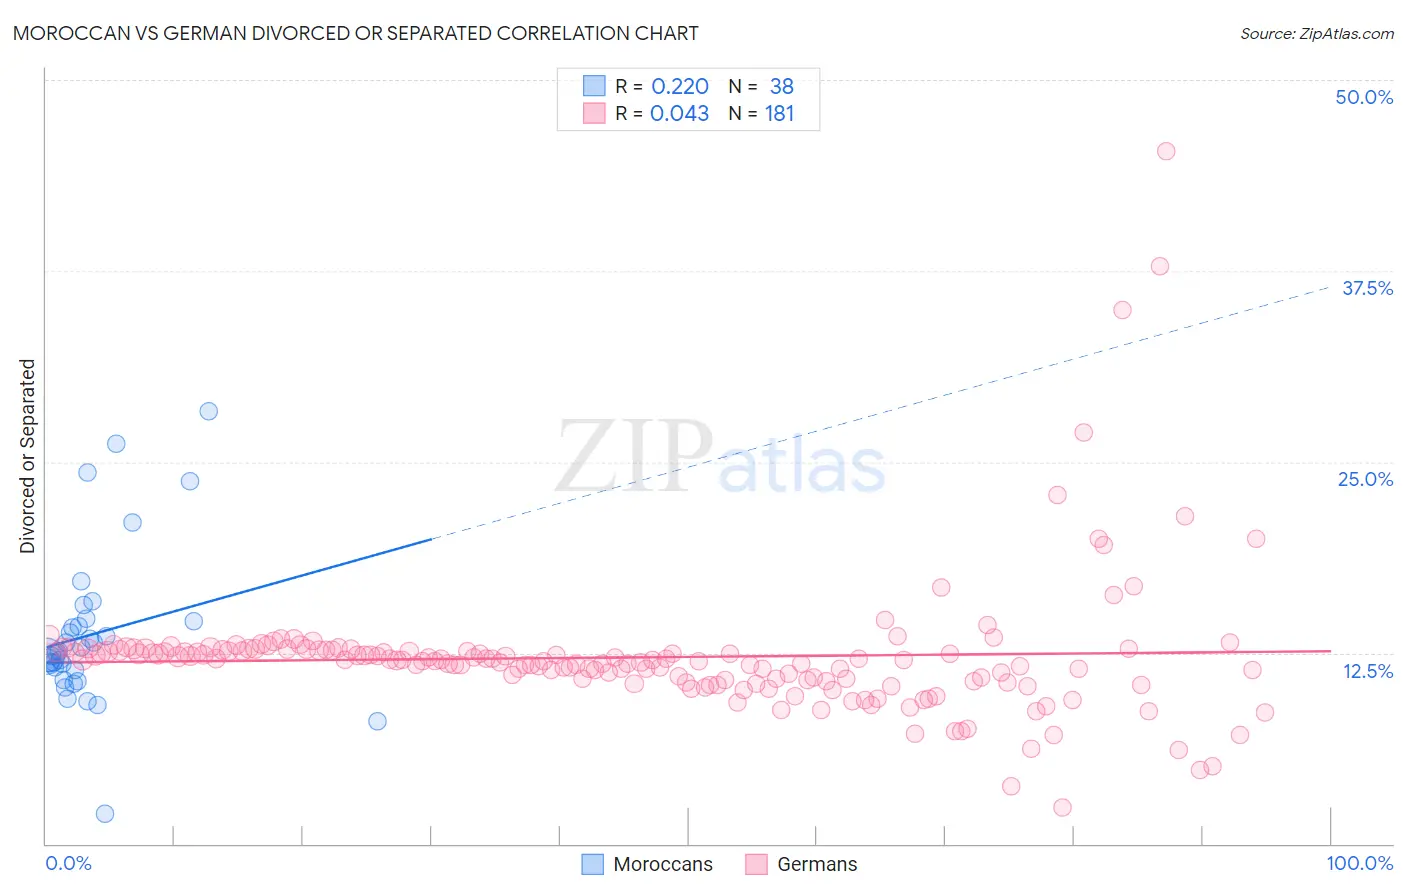
Moroccan vs German Divorced or Separated Correlation Chart
The statistical analysis conducted on geographies consisting of 201,776,444 people shows a weak positive correlation between the proportion of Moroccans and percentage of population currently divorced or separated in the United States with a correlation coefficient (R) of 0.220 and weighted average of 12.1%. Similarly, the statistical analysis conducted on geographies consisting of 580,609,832 people shows no correlation between the proportion of Germans and percentage of population currently divorced or separated in the United States with a correlation coefficient (R) of 0.043 and weighted average of 12.5%, a difference of 2.9%.
Divorced or Separated Correlation Summary
| Measurement | Moroccan | German |
| Minimum | 2.0% | 2.4% |
| Maximum | 28.3% | 45.3% |
| Range | 26.3% | 42.9% |
| Mean | 13.7% | 12.2% |
| Median | 12.6% | 12.0% |
| Interquartile 25% (IQ1) | 11.4% | 10.7% |
| Interquartile 75% (IQ3) | 14.6% | 12.7% |
| Interquartile Range (IQR) | 3.2% | 2.0% |
| Standard Deviation (Sample) | 5.1% | 4.5% |
| Standard Deviation (Population) | 5.0% | 4.5% |
Similar Demographics by Divorced or Separated
Demographics Similar to Moroccans by Divorced or Separated
In terms of divorced or separated, the demographic groups most similar to Moroccans are Swedish (12.1%, a difference of 0.020%), Sierra Leonean (12.1%, a difference of 0.030%), Norwegian (12.1%, a difference of 0.060%), Immigrants from Thailand (12.1%, a difference of 0.090%), and Immigrants from Belize (12.1%, a difference of 0.10%).
| Demographics | Rating | Rank | Divorced or Separated |
| Immigrants | Central America | 42.9 /100 | #183 | Average 12.1% |
| Immigrants | North America | 41.1 /100 | #184 | Average 12.1% |
| Immigrants | Nigeria | 40.5 /100 | #185 | Average 12.1% |
| Immigrants | Chile | 39.0 /100 | #186 | Fair 12.1% |
| Belizeans | 37.7 /100 | #187 | Fair 12.1% |
| Immigrants | Belize | 37.6 /100 | #188 | Fair 12.1% |
| Sierra Leoneans | 35.5 /100 | #189 | Fair 12.1% |
| Moroccans | 34.8 /100 | #190 | Fair 12.1% |
| Swedes | 34.4 /100 | #191 | Fair 12.1% |
| Norwegians | 33.2 /100 | #192 | Fair 12.1% |
| Immigrants | Thailand | 32.5 /100 | #193 | Fair 12.1% |
| Immigrants | Eritrea | 31.9 /100 | #194 | Fair 12.1% |
| Immigrants | England | 31.4 /100 | #195 | Fair 12.1% |
| Immigrants | Burma/Myanmar | 30.4 /100 | #196 | Fair 12.1% |
| Immigrants | Africa | 30.3 /100 | #197 | Fair 12.1% |
Demographics Similar to Germans by Divorced or Separated
In terms of divorced or separated, the demographic groups most similar to Germans are Nepalese (12.5%, a difference of 0.020%), Immigrants from West Indies (12.5%, a difference of 0.030%), Finnish (12.5%, a difference of 0.040%), Hispanic or Latino (12.5%, a difference of 0.050%), and Alaska Native (12.4%, a difference of 0.27%).
| Demographics | Rating | Rank | Divorced or Separated |
| British West Indians | 3.7 /100 | #240 | Tragic 12.4% |
| Uruguayans | 3.4 /100 | #241 | Tragic 12.4% |
| Dutch | 3.1 /100 | #242 | Tragic 12.4% |
| Immigrants | Latin America | 2.8 /100 | #243 | Tragic 12.4% |
| Alaska Natives | 2.5 /100 | #244 | Tragic 12.4% |
| Hispanics or Latinos | 2.0 /100 | #245 | Tragic 12.5% |
| Immigrants | West Indies | 1.9 /100 | #246 | Tragic 12.5% |
| Germans | 1.8 /100 | #247 | Tragic 12.5% |
| Nepalese | 1.8 /100 | #248 | Tragic 12.5% |
| Finns | 1.8 /100 | #249 | Tragic 12.5% |
| Irish | 1.3 /100 | #250 | Tragic 12.5% |
| Aleuts | 1.3 /100 | #251 | Tragic 12.5% |
| Liberians | 0.9 /100 | #252 | Tragic 12.6% |
| Somalis | 0.9 /100 | #253 | Tragic 12.6% |
| Senegalese | 0.8 /100 | #254 | Tragic 12.6% |