Moroccan vs Pima Unemployment Among Ages 35 to 44 years
COMPARE
Moroccan
Pima
Unemployment Among Ages 35 to 44 years
Unemployment Among Ages 35 to 44 years Comparison
Moroccans
Pima
4.9%
UNEMPLOYMENT AMONG AGES 35 TO 44 YEARS
6.0/ 100
METRIC RATING
217th/ 347
METRIC RANK
11.8%
UNEMPLOYMENT AMONG AGES 35 TO 44 YEARS
0.0/ 100
METRIC RATING
344th/ 347
METRIC RANK
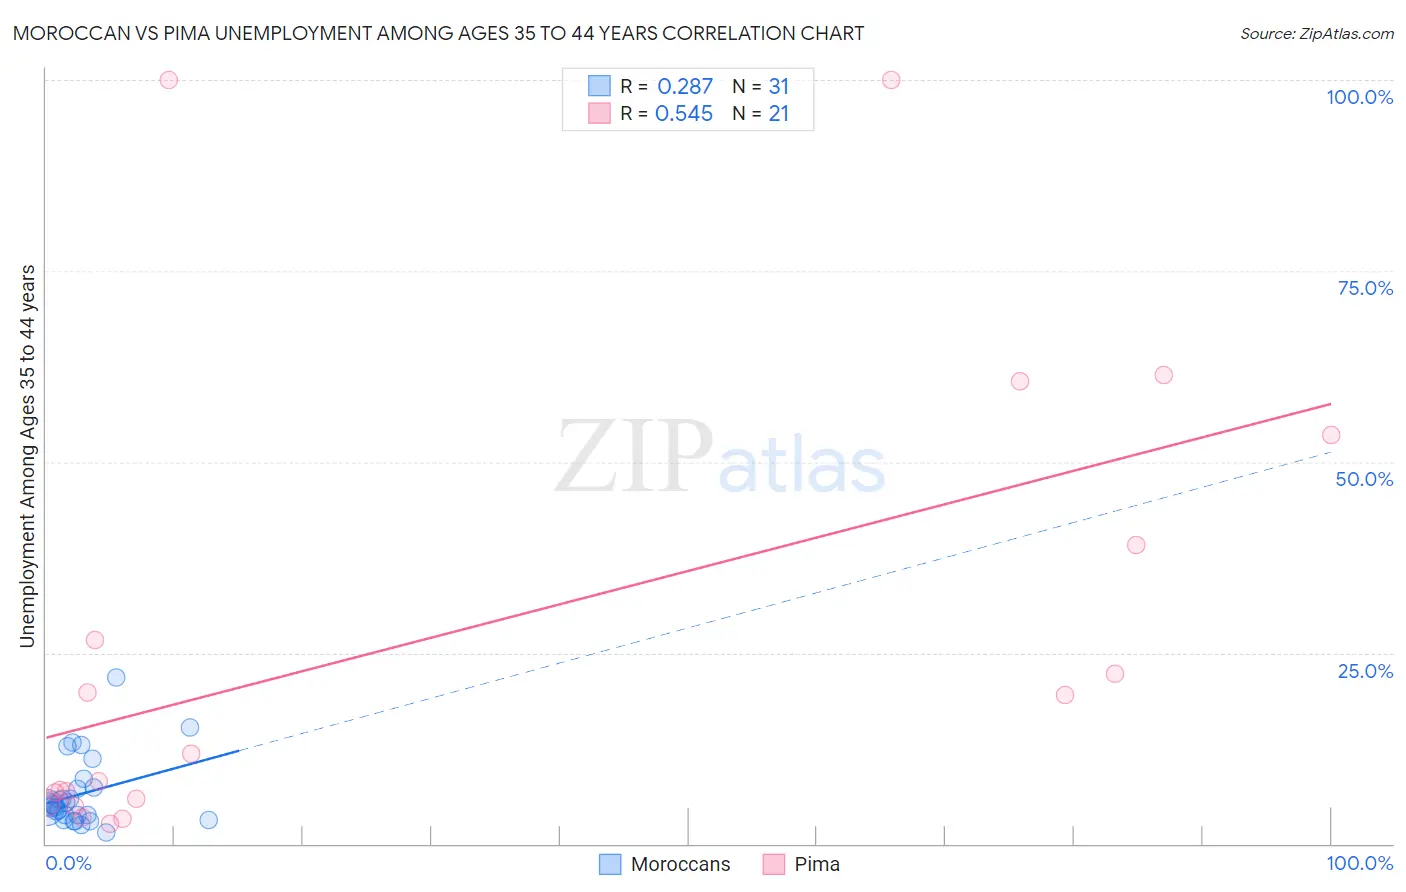
Moroccan vs Pima Unemployment Among Ages 35 to 44 years Correlation Chart
The statistical analysis conducted on geographies consisting of 200,434,316 people shows a weak positive correlation between the proportion of Moroccans and unemployment rate among population between the ages 35 and 44 in the United States with a correlation coefficient (R) of 0.287 and weighted average of 4.9%. Similarly, the statistical analysis conducted on geographies consisting of 61,252,012 people shows a substantial positive correlation between the proportion of Pima and unemployment rate among population between the ages 35 and 44 in the United States with a correlation coefficient (R) of 0.545 and weighted average of 11.8%, a difference of 139.2%.
Unemployment Among Ages 35 to 44 years Correlation Summary
| Measurement | Moroccan | Pima |
| Minimum | 1.5% | 2.7% |
| Maximum | 21.8% | 100.0% |
| Range | 20.3% | 97.3% |
| Mean | 6.5% | 27.1% |
| Median | 5.0% | 11.8% |
| Interquartile 25% (IQ1) | 3.7% | 5.6% |
| Interquartile 75% (IQ3) | 7.3% | 46.3% |
| Interquartile Range (IQR) | 3.6% | 40.7% |
| Standard Deviation (Sample) | 4.5% | 30.7% |
| Standard Deviation (Population) | 4.4% | 30.0% |
Similar Demographics by Unemployment Among Ages 35 to 44 years
Demographics Similar to Moroccans by Unemployment Among Ages 35 to 44 years
In terms of unemployment among ages 35 to 44 years, the demographic groups most similar to Moroccans are American (4.9%, a difference of 0.040%), Chickasaw (4.9%, a difference of 0.11%), Sierra Leonean (4.9%, a difference of 0.42%), Immigrants from Sierra Leone (4.9%, a difference of 0.45%), and Immigrants (4.9%, a difference of 0.51%).
| Demographics | Rating | Rank | Unemployment Among Ages 35 to 44 years |
| Immigrants | Cameroon | 11.4 /100 | #210 | Poor 4.9% |
| Immigrants | Nonimmigrants | 9.4 /100 | #211 | Tragic 4.9% |
| Fijians | 8.7 /100 | #212 | Tragic 4.9% |
| Osage | 8.6 /100 | #213 | Tragic 4.9% |
| Immigrants | Africa | 8.2 /100 | #214 | Tragic 4.9% |
| Immigrants | Immigrants | 8.0 /100 | #215 | Tragic 4.9% |
| Americans | 6.2 /100 | #216 | Tragic 4.9% |
| Moroccans | 6.0 /100 | #217 | Tragic 4.9% |
| Chickasaw | 5.7 /100 | #218 | Tragic 4.9% |
| Sierra Leoneans | 4.8 /100 | #219 | Tragic 4.9% |
| Immigrants | Sierra Leone | 4.7 /100 | #220 | Tragic 4.9% |
| Bermudans | 3.9 /100 | #221 | Tragic 5.0% |
| Hmong | 3.5 /100 | #222 | Tragic 5.0% |
| Immigrants | Panama | 3.3 /100 | #223 | Tragic 5.0% |
| Panamanians | 2.9 /100 | #224 | Tragic 5.0% |
Demographics Similar to Pima by Unemployment Among Ages 35 to 44 years
In terms of unemployment among ages 35 to 44 years, the demographic groups most similar to Pima are Arapaho (10.3%, a difference of 14.3%), Yup'ik (14.4%, a difference of 22.8%), Navajo (9.3%, a difference of 25.9%), Hopi (8.9%, a difference of 32.4%), and Crow (15.7%, a difference of 33.6%).
| Demographics | Rating | Rank | Unemployment Among Ages 35 to 44 years |
| Puerto Ricans | 0.0 /100 | #333 | Tragic 7.6% |
| Houma | 0.0 /100 | #334 | Tragic 7.8% |
| Sioux | 0.0 /100 | #335 | Tragic 8.4% |
| Apache | 0.0 /100 | #336 | Tragic 8.4% |
| Tohono O'odham | 0.0 /100 | #337 | Tragic 8.4% |
| Cheyenne | 0.0 /100 | #338 | Tragic 8.5% |
| Inupiat | 0.0 /100 | #339 | Tragic 8.6% |
| Alaskan Athabascans | 0.0 /100 | #340 | Tragic 8.6% |
| Hopi | 0.0 /100 | #341 | Tragic 8.9% |
| Navajo | 0.0 /100 | #342 | Tragic 9.3% |
| Arapaho | 0.0 /100 | #343 | Tragic 10.3% |
| Pima | 0.0 /100 | #344 | Tragic 11.8% |
| Yup'ik | 0.0 /100 | #345 | Tragic 14.4% |
| Crow | 0.0 /100 | #346 | Tragic 15.7% |
| Yuman | 0.0 /100 | #347 | Tragic 16.9% |