Immigrants from Mexico vs Osage Average Family Size
COMPARE
Immigrants from Mexico
Osage
Average Family Size
Average Family Size Comparison
Immigrants from Mexico
Osage
3.52
AVERAGE FAMILY SIZE
100.0/ 100
METRIC RATING
12th/ 347
METRIC RANK
3.18
AVERAGE FAMILY SIZE
3.2/ 100
METRIC RATING
240th/ 347
METRIC RANK
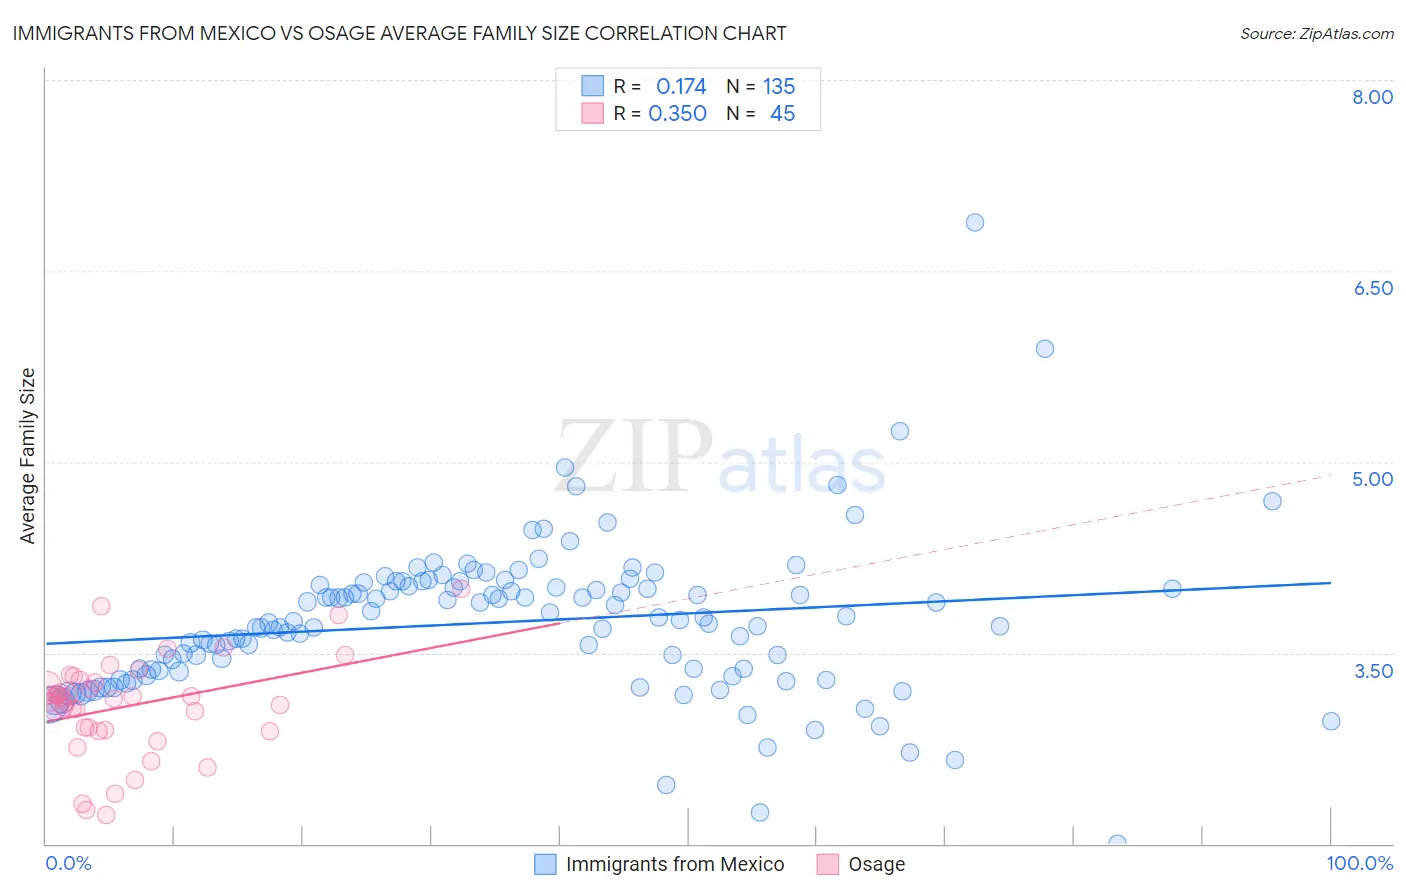
Immigrants from Mexico vs Osage Average Family Size Correlation Chart
The statistical analysis conducted on geographies consisting of 513,403,762 people shows a poor positive correlation between the proportion of Immigrants from Mexico and average family size in the United States with a correlation coefficient (R) of 0.174 and weighted average of 3.52. Similarly, the statistical analysis conducted on geographies consisting of 91,797,548 people shows a mild positive correlation between the proportion of Osage and average family size in the United States with a correlation coefficient (R) of 0.350 and weighted average of 3.18, a difference of 10.7%.
Average Family Size Correlation Summary
| Measurement | Immigrants from Mexico | Osage |
| Minimum | 2.00 | 2.23 |
| Maximum | 6.88 | 4.00 |
| Range | 4.88 | 1.77 |
| Mean | 3.74 | 3.08 |
| Median | 3.73 | 3.14 |
| Interquartile 25% (IQ1) | 3.35 | 2.89 |
| Interquartile 75% (IQ3) | 4.02 | 3.27 |
| Interquartile Range (IQR) | 0.66 | 0.38 |
| Standard Deviation (Sample) | 0.61 | 0.39 |
| Standard Deviation (Population) | 0.60 | 0.38 |
Similar Demographics by Average Family Size
Demographics Similar to Immigrants from Mexico by Average Family Size
In terms of average family size, the demographic groups most similar to Immigrants from Mexico are Sioux (3.52, a difference of 0.080%), Tohono O'odham (3.53, a difference of 0.42%), Immigrants from Central America (3.49, a difference of 0.71%), Tongan (3.49, a difference of 0.76%), and Ute (3.49, a difference of 0.82%).
| Demographics | Rating | Rank | Average Family Size |
| Navajo | 100.0 /100 | #5 | Exceptional 3.65 |
| Arapaho | 100.0 /100 | #6 | Exceptional 3.64 |
| Inupiat | 100.0 /100 | #7 | Exceptional 3.63 |
| Immigrants | Yemen | 100.0 /100 | #8 | Exceptional 3.60 |
| Hopi | 100.0 /100 | #9 | Exceptional 3.60 |
| Spanish American Indians | 100.0 /100 | #10 | Exceptional 3.58 |
| Tohono O'odham | 100.0 /100 | #11 | Exceptional 3.53 |
| Immigrants | Mexico | 100.0 /100 | #12 | Exceptional 3.52 |
| Sioux | 100.0 /100 | #13 | Exceptional 3.52 |
| Immigrants | Central America | 100.0 /100 | #14 | Exceptional 3.49 |
| Tongans | 100.0 /100 | #15 | Exceptional 3.49 |
| Ute | 100.0 /100 | #16 | Exceptional 3.49 |
| Immigrants | El Salvador | 100.0 /100 | #17 | Exceptional 3.49 |
| Salvadorans | 100.0 /100 | #18 | Exceptional 3.48 |
| Mexicans | 100.0 /100 | #19 | Exceptional 3.48 |
Demographics Similar to Osage by Average Family Size
In terms of average family size, the demographic groups most similar to Osage are Houma (3.18, a difference of 0.020%), Immigrants from Japan (3.18, a difference of 0.020%), Hungarian (3.18, a difference of 0.040%), Immigrants from Moldova (3.18, a difference of 0.040%), and Immigrants from Southern Europe (3.18, a difference of 0.050%).
| Demographics | Rating | Rank | Average Family Size |
| Brazilians | 4.5 /100 | #233 | Tragic 3.18 |
| Iranians | 4.5 /100 | #234 | Tragic 3.18 |
| Immigrants | Turkey | 4.2 /100 | #235 | Tragic 3.18 |
| Immigrants | Portugal | 4.2 /100 | #236 | Tragic 3.18 |
| Immigrants | Romania | 3.7 /100 | #237 | Tragic 3.18 |
| Romanians | 3.7 /100 | #238 | Tragic 3.18 |
| Houma | 3.4 /100 | #239 | Tragic 3.18 |
| Osage | 3.2 /100 | #240 | Tragic 3.18 |
| Immigrants | Japan | 3.0 /100 | #241 | Tragic 3.18 |
| Hungarians | 3.0 /100 | #242 | Tragic 3.18 |
| Immigrants | Moldova | 2.9 /100 | #243 | Tragic 3.18 |
| Immigrants | Southern Europe | 2.9 /100 | #244 | Tragic 3.18 |
| Immigrants | Brazil | 2.7 /100 | #245 | Tragic 3.18 |
| Danes | 2.5 /100 | #246 | Tragic 3.17 |
| Cajuns | 2.4 /100 | #247 | Tragic 3.17 |