Chinese vs Spaniard Currently Married
COMPARE
Chinese
Spaniard
Currently Married
Currently Married Comparison
Chinese
Spaniards
49.5%
CURRENTLY MARRIED
99.9/ 100
METRIC RATING
16th/ 347
METRIC RANK
46.8%
CURRENTLY MARRIED
58.8/ 100
METRIC RATING
167th/ 347
METRIC RANK
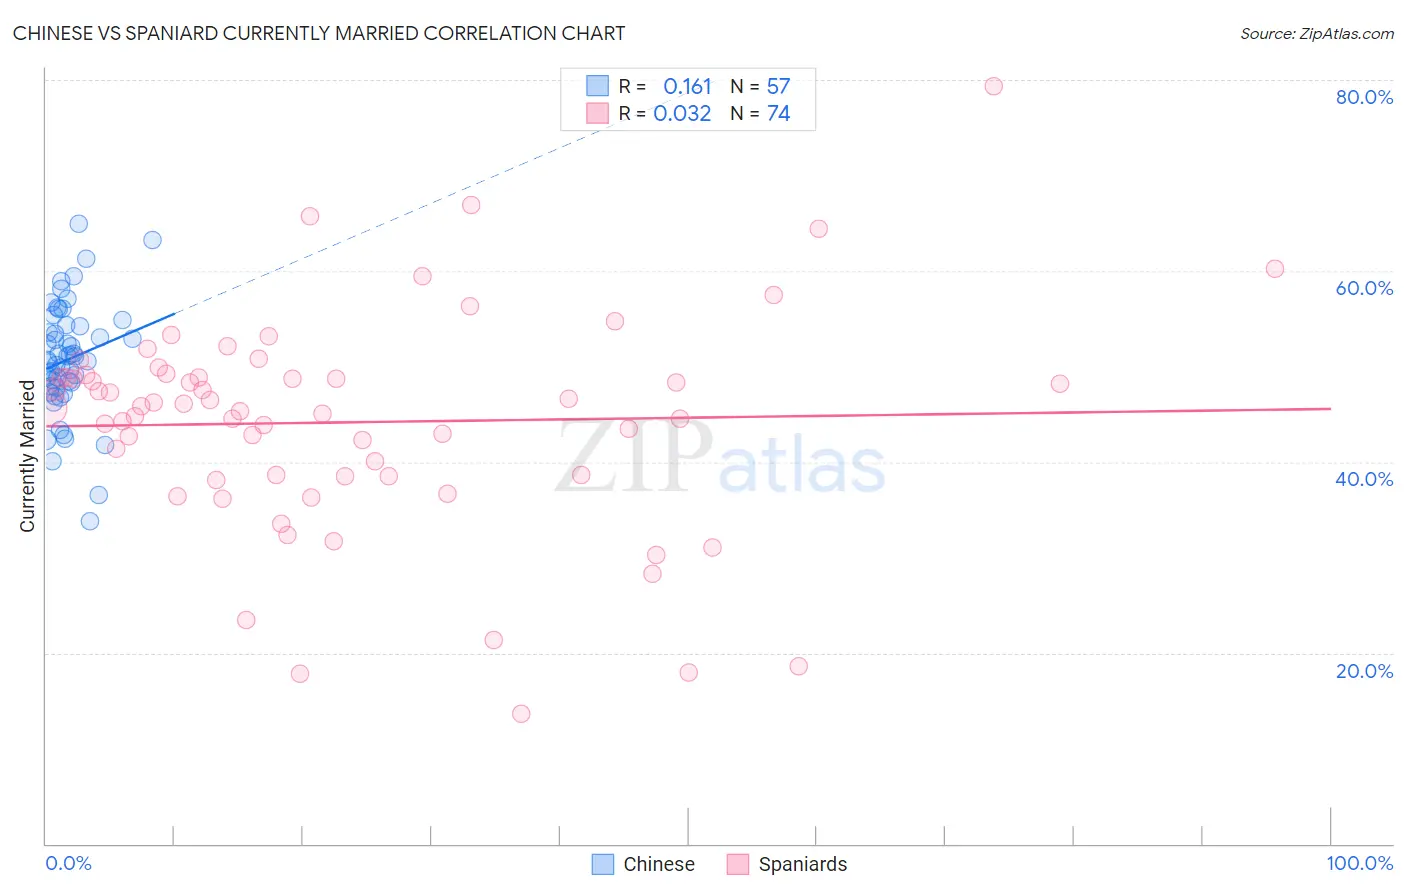
Chinese vs Spaniard Currently Married Correlation Chart
The statistical analysis conducted on geographies consisting of 64,808,439 people shows a poor positive correlation between the proportion of Chinese and percentage of population currently married in the United States with a correlation coefficient (R) of 0.161 and weighted average of 49.5%. Similarly, the statistical analysis conducted on geographies consisting of 443,497,994 people shows no correlation between the proportion of Spaniards and percentage of population currently married in the United States with a correlation coefficient (R) of 0.032 and weighted average of 46.8%, a difference of 5.8%.
Currently Married Correlation Summary
| Measurement | Chinese | Spaniard |
| Minimum | 33.8% | 13.6% |
| Maximum | 64.9% | 79.3% |
| Range | 31.1% | 65.7% |
| Mean | 50.7% | 44.1% |
| Median | 50.7% | 45.8% |
| Interquartile 25% (IQ1) | 47.9% | 38.5% |
| Interquartile 75% (IQ3) | 54.3% | 48.9% |
| Interquartile Range (IQR) | 6.4% | 10.3% |
| Standard Deviation (Sample) | 6.0% | 11.5% |
| Standard Deviation (Population) | 5.9% | 11.4% |
Similar Demographics by Currently Married
Demographics Similar to Chinese by Currently Married
In terms of currently married, the demographic groups most similar to Chinese are Scandinavian (49.5%, a difference of 0.020%), Pennsylvania German (49.6%, a difference of 0.14%), German (49.6%, a difference of 0.17%), Dutch (49.6%, a difference of 0.18%), and Immigrants from Scotland (49.3%, a difference of 0.31%).
| Demographics | Rating | Rank | Currently Married |
| Czechs | 99.9 /100 | #9 | Exceptional 49.9% |
| Filipinos | 99.9 /100 | #10 | Exceptional 49.7% |
| English | 99.9 /100 | #11 | Exceptional 49.7% |
| Swiss | 99.9 /100 | #12 | Exceptional 49.7% |
| Dutch | 99.9 /100 | #13 | Exceptional 49.6% |
| Germans | 99.9 /100 | #14 | Exceptional 49.6% |
| Pennsylvania Germans | 99.9 /100 | #15 | Exceptional 49.6% |
| Chinese | 99.9 /100 | #16 | Exceptional 49.5% |
| Scandinavians | 99.9 /100 | #17 | Exceptional 49.5% |
| Immigrants | Scotland | 99.8 /100 | #18 | Exceptional 49.3% |
| Europeans | 99.8 /100 | #19 | Exceptional 49.3% |
| Luxembourgers | 99.8 /100 | #20 | Exceptional 49.3% |
| Scottish | 99.8 /100 | #21 | Exceptional 49.2% |
| Bulgarians | 99.7 /100 | #22 | Exceptional 49.1% |
| Immigrants | Pakistan | 99.7 /100 | #23 | Exceptional 49.1% |
Demographics Similar to Spaniards by Currently Married
In terms of currently married, the demographic groups most similar to Spaniards are Immigrants from Syria (46.8%, a difference of 0.020%), Immigrants from Afghanistan (46.8%, a difference of 0.020%), Armenian (46.8%, a difference of 0.020%), Samoan (46.8%, a difference of 0.040%), and Immigrants from Latvia (46.7%, a difference of 0.080%).
| Demographics | Rating | Rank | Currently Married |
| Immigrants | Uzbekistan | 66.0 /100 | #160 | Good 46.9% |
| Immigrants | Southern Europe | 65.9 /100 | #161 | Good 46.9% |
| Immigrants | Nonimmigrants | 65.4 /100 | #162 | Good 46.9% |
| Delaware | 64.7 /100 | #163 | Good 46.9% |
| Immigrants | Western Asia | 64.2 /100 | #164 | Good 46.9% |
| Samoans | 59.8 /100 | #165 | Average 46.8% |
| Immigrants | Syria | 59.3 /100 | #166 | Average 46.8% |
| Spaniards | 58.8 /100 | #167 | Average 46.8% |
| Immigrants | Afghanistan | 58.2 /100 | #168 | Average 46.8% |
| Armenians | 58.2 /100 | #169 | Average 46.8% |
| Immigrants | Latvia | 56.7 /100 | #170 | Average 46.7% |
| Immigrants | Zimbabwe | 52.4 /100 | #171 | Average 46.7% |
| Aleuts | 52.0 /100 | #172 | Average 46.7% |
| Tlingit-Haida | 51.2 /100 | #173 | Average 46.7% |
| Peruvians | 50.0 /100 | #174 | Average 46.6% |