Mongolian vs Spaniard 3rd Grade
COMPARE
Mongolian
Spaniard
3rd Grade
3rd Grade Comparison
Mongolians
Spaniards
97.7%
3RD GRADE
29.1/ 100
METRIC RATING
192nd/ 347
METRIC RANK
97.9%
3RD GRADE
87.9/ 100
METRIC RATING
136th/ 347
METRIC RANK
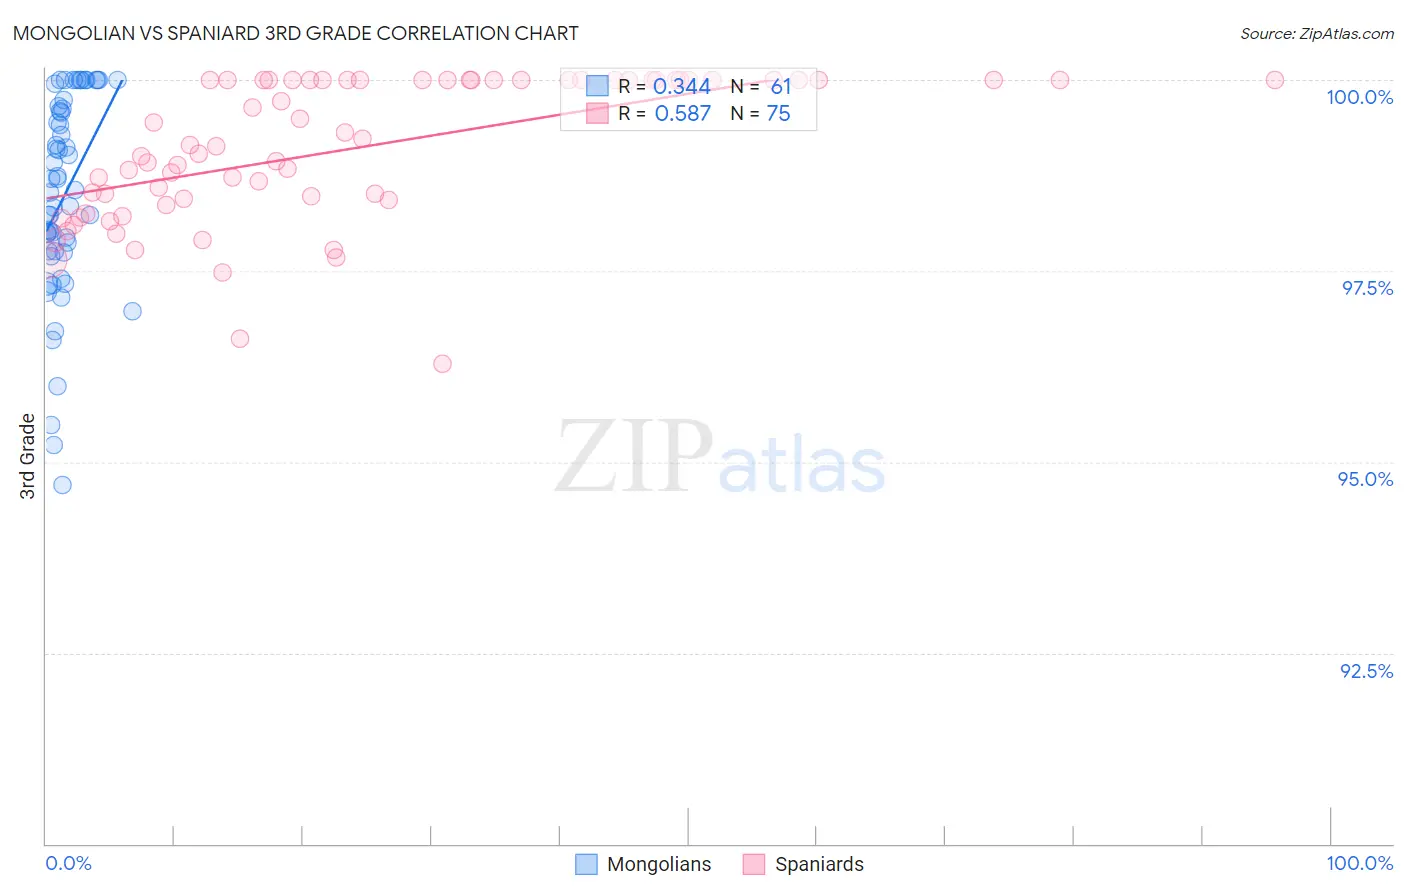
Mongolian vs Spaniard 3rd Grade Correlation Chart
The statistical analysis conducted on geographies consisting of 140,362,004 people shows a mild positive correlation between the proportion of Mongolians and percentage of population with at least 3rd grade education in the United States with a correlation coefficient (R) of 0.344 and weighted average of 97.7%. Similarly, the statistical analysis conducted on geographies consisting of 443,544,503 people shows a substantial positive correlation between the proportion of Spaniards and percentage of population with at least 3rd grade education in the United States with a correlation coefficient (R) of 0.587 and weighted average of 97.9%, a difference of 0.24%.
3rd Grade Correlation Summary
| Measurement | Mongolian | Spaniard |
| Minimum | 94.7% | 96.3% |
| Maximum | 100.0% | 100.0% |
| Range | 5.3% | 3.7% |
| Mean | 98.5% | 99.1% |
| Median | 98.6% | 99.2% |
| Interquartile 25% (IQ1) | 97.7% | 98.4% |
| Interquartile 75% (IQ3) | 99.6% | 100.0% |
| Interquartile Range (IQR) | 1.9% | 1.6% |
| Standard Deviation (Sample) | 1.3% | 0.94% |
| Standard Deviation (Population) | 1.3% | 0.93% |
Similar Demographics by 3rd Grade
Demographics Similar to Mongolians by 3rd Grade
In terms of 3rd grade, the demographic groups most similar to Mongolians are Black/African American (97.7%, a difference of 0.0%), Immigrants from Kenya (97.7%, a difference of 0.0%), Panamanian (97.7%, a difference of 0.010%), Immigrants from Uganda (97.7%, a difference of 0.010%), and Immigrants from Egypt (97.7%, a difference of 0.010%).
| Demographics | Rating | Rank | 3rd Grade |
| Immigrants | Argentina | 37.0 /100 | #185 | Fair 97.7% |
| Portuguese | 36.2 /100 | #186 | Fair 97.7% |
| Natives/Alaskans | 35.2 /100 | #187 | Fair 97.7% |
| Immigrants | Taiwan | 34.2 /100 | #188 | Fair 97.7% |
| Pakistanis | 34.2 /100 | #189 | Fair 97.7% |
| Panamanians | 31.5 /100 | #190 | Fair 97.7% |
| Blacks/African Americans | 29.6 /100 | #191 | Fair 97.7% |
| Mongolians | 29.1 /100 | #192 | Fair 97.7% |
| Immigrants | Kenya | 28.2 /100 | #193 | Fair 97.7% |
| Immigrants | Uganda | 27.4 /100 | #194 | Fair 97.7% |
| Immigrants | Egypt | 26.8 /100 | #195 | Fair 97.7% |
| Paraguayans | 26.2 /100 | #196 | Fair 97.7% |
| Hawaiians | 25.7 /100 | #197 | Fair 97.7% |
| Guamanians/Chamorros | 23.6 /100 | #198 | Fair 97.7% |
| Immigrants | Ukraine | 22.7 /100 | #199 | Fair 97.7% |
Demographics Similar to Spaniards by 3rd Grade
In terms of 3rd grade, the demographic groups most similar to Spaniards are Cambodian (97.9%, a difference of 0.0%), Immigrants from Romania (97.9%, a difference of 0.0%), Immigrants from Bulgaria (97.9%, a difference of 0.010%), Immigrants from Hungary (97.9%, a difference of 0.010%), and Immigrants from Kuwait (97.9%, a difference of 0.010%).
| Demographics | Rating | Rank | 3rd Grade |
| Immigrants | Serbia | 91.9 /100 | #129 | Exceptional 98.0% |
| Immigrants | Europe | 91.2 /100 | #130 | Exceptional 98.0% |
| Immigrants | Bulgaria | 89.1 /100 | #131 | Excellent 97.9% |
| Immigrants | Hungary | 88.8 /100 | #132 | Excellent 97.9% |
| Immigrants | Kuwait | 88.7 /100 | #133 | Excellent 97.9% |
| Seminole | 88.7 /100 | #134 | Excellent 97.9% |
| Cambodians | 88.1 /100 | #135 | Excellent 97.9% |
| Spaniards | 87.9 /100 | #136 | Excellent 97.9% |
| Immigrants | Romania | 87.9 /100 | #137 | Excellent 97.9% |
| Israelis | 86.6 /100 | #138 | Excellent 97.9% |
| Blackfeet | 86.3 /100 | #139 | Excellent 97.9% |
| Palestinians | 84.6 /100 | #140 | Excellent 97.9% |
| Immigrants | Turkey | 83.5 /100 | #141 | Excellent 97.9% |
| Hmong | 80.3 /100 | #142 | Excellent 97.9% |
| Filipinos | 79.9 /100 | #143 | Good 97.9% |