Kenyan vs Spaniard Currently Married
COMPARE
Kenyan
Spaniard
Currently Married
Currently Married Comparison
Kenyans
Spaniards
45.2%
CURRENTLY MARRIED
3.1/ 100
METRIC RATING
220th/ 347
METRIC RANK
46.8%
CURRENTLY MARRIED
58.8/ 100
METRIC RATING
167th/ 347
METRIC RANK
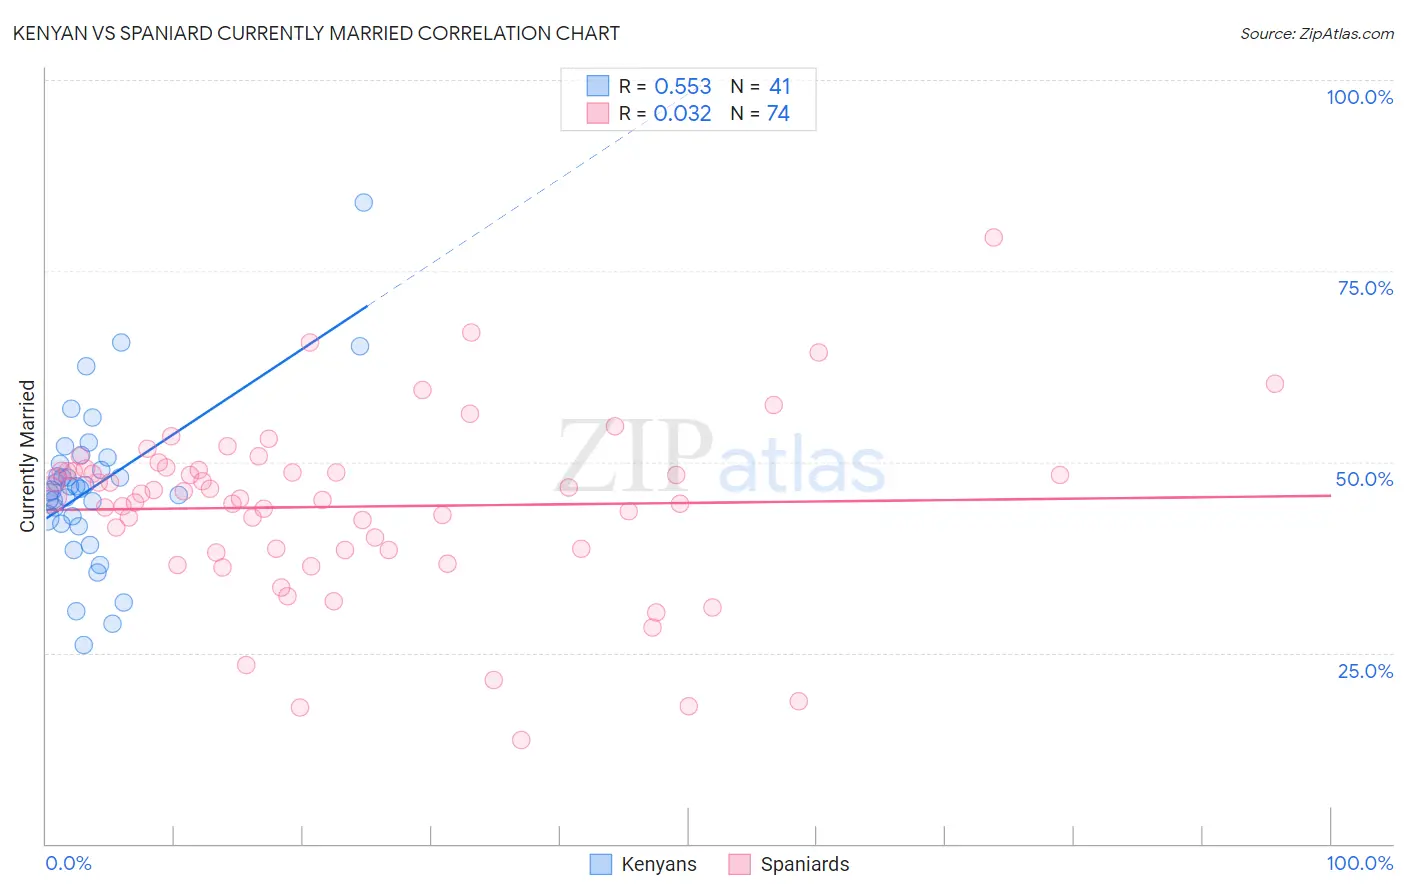
Kenyan vs Spaniard Currently Married Correlation Chart
The statistical analysis conducted on geographies consisting of 168,238,911 people shows a substantial positive correlation between the proportion of Kenyans and percentage of population currently married in the United States with a correlation coefficient (R) of 0.553 and weighted average of 45.2%. Similarly, the statistical analysis conducted on geographies consisting of 443,497,994 people shows no correlation between the proportion of Spaniards and percentage of population currently married in the United States with a correlation coefficient (R) of 0.032 and weighted average of 46.8%, a difference of 3.6%.
Currently Married Correlation Summary
| Measurement | Kenyan | Spaniard |
| Minimum | 26.0% | 13.6% |
| Maximum | 83.9% | 79.3% |
| Range | 57.9% | 65.7% |
| Mean | 46.8% | 44.1% |
| Median | 46.5% | 45.8% |
| Interquartile 25% (IQ1) | 42.3% | 38.5% |
| Interquartile 75% (IQ3) | 50.1% | 48.9% |
| Interquartile Range (IQR) | 7.8% | 10.3% |
| Standard Deviation (Sample) | 10.4% | 11.5% |
| Standard Deviation (Population) | 10.3% | 11.4% |
Similar Demographics by Currently Married
Demographics Similar to Kenyans by Currently Married
In terms of currently married, the demographic groups most similar to Kenyans are Mexican (45.2%, a difference of 0.020%), Immigrants from Portugal (45.2%, a difference of 0.13%), Immigrants from the Azores (45.1%, a difference of 0.22%), Panamanian (45.3%, a difference of 0.24%), and Immigrants from Laos (45.0%, a difference of 0.30%).
| Demographics | Rating | Rank | Currently Married |
| Alaska Natives | 7.0 /100 | #213 | Tragic 45.5% |
| Dutch West Indians | 6.7 /100 | #214 | Tragic 45.5% |
| German Russians | 6.7 /100 | #215 | Tragic 45.5% |
| Immigrants | Morocco | 5.5 /100 | #216 | Tragic 45.4% |
| Immigrants | Thailand | 5.1 /100 | #217 | Tragic 45.4% |
| Panamanians | 4.0 /100 | #218 | Tragic 45.3% |
| Immigrants | Portugal | 3.5 /100 | #219 | Tragic 45.2% |
| Kenyans | 3.1 /100 | #220 | Tragic 45.2% |
| Mexicans | 3.0 /100 | #221 | Tragic 45.2% |
| Immigrants | Azores | 2.5 /100 | #222 | Tragic 45.1% |
| Immigrants | Laos | 2.3 /100 | #223 | Tragic 45.0% |
| Immigrants | Uganda | 2.2 /100 | #224 | Tragic 45.0% |
| French American Indians | 2.2 /100 | #225 | Tragic 45.0% |
| Comanche | 2.1 /100 | #226 | Tragic 45.0% |
| Spanish Americans | 2.1 /100 | #227 | Tragic 45.0% |
Demographics Similar to Spaniards by Currently Married
In terms of currently married, the demographic groups most similar to Spaniards are Immigrants from Syria (46.8%, a difference of 0.020%), Immigrants from Afghanistan (46.8%, a difference of 0.020%), Armenian (46.8%, a difference of 0.020%), Samoan (46.8%, a difference of 0.040%), and Immigrants from Latvia (46.7%, a difference of 0.080%).
| Demographics | Rating | Rank | Currently Married |
| Immigrants | Uzbekistan | 66.0 /100 | #160 | Good 46.9% |
| Immigrants | Southern Europe | 65.9 /100 | #161 | Good 46.9% |
| Immigrants | Nonimmigrants | 65.4 /100 | #162 | Good 46.9% |
| Delaware | 64.7 /100 | #163 | Good 46.9% |
| Immigrants | Western Asia | 64.2 /100 | #164 | Good 46.9% |
| Samoans | 59.8 /100 | #165 | Average 46.8% |
| Immigrants | Syria | 59.3 /100 | #166 | Average 46.8% |
| Spaniards | 58.8 /100 | #167 | Average 46.8% |
| Immigrants | Afghanistan | 58.2 /100 | #168 | Average 46.8% |
| Armenians | 58.2 /100 | #169 | Average 46.8% |
| Immigrants | Latvia | 56.7 /100 | #170 | Average 46.7% |
| Immigrants | Zimbabwe | 52.4 /100 | #171 | Average 46.7% |
| Aleuts | 52.0 /100 | #172 | Average 46.7% |
| Tlingit-Haida | 51.2 /100 | #173 | Average 46.7% |
| Peruvians | 50.0 /100 | #174 | Average 46.6% |