Mexican vs Immigrants from Belarus Currently Married
COMPARE
Mexican
Immigrants from Belarus
Currently Married
Currently Married Comparison
Mexicans
Immigrants from Belarus
45.2%
CURRENTLY MARRIED
3.0/ 100
METRIC RATING
221st/ 347
METRIC RANK
48.1%
CURRENTLY MARRIED
97.2/ 100
METRIC RATING
75th/ 347
METRIC RANK
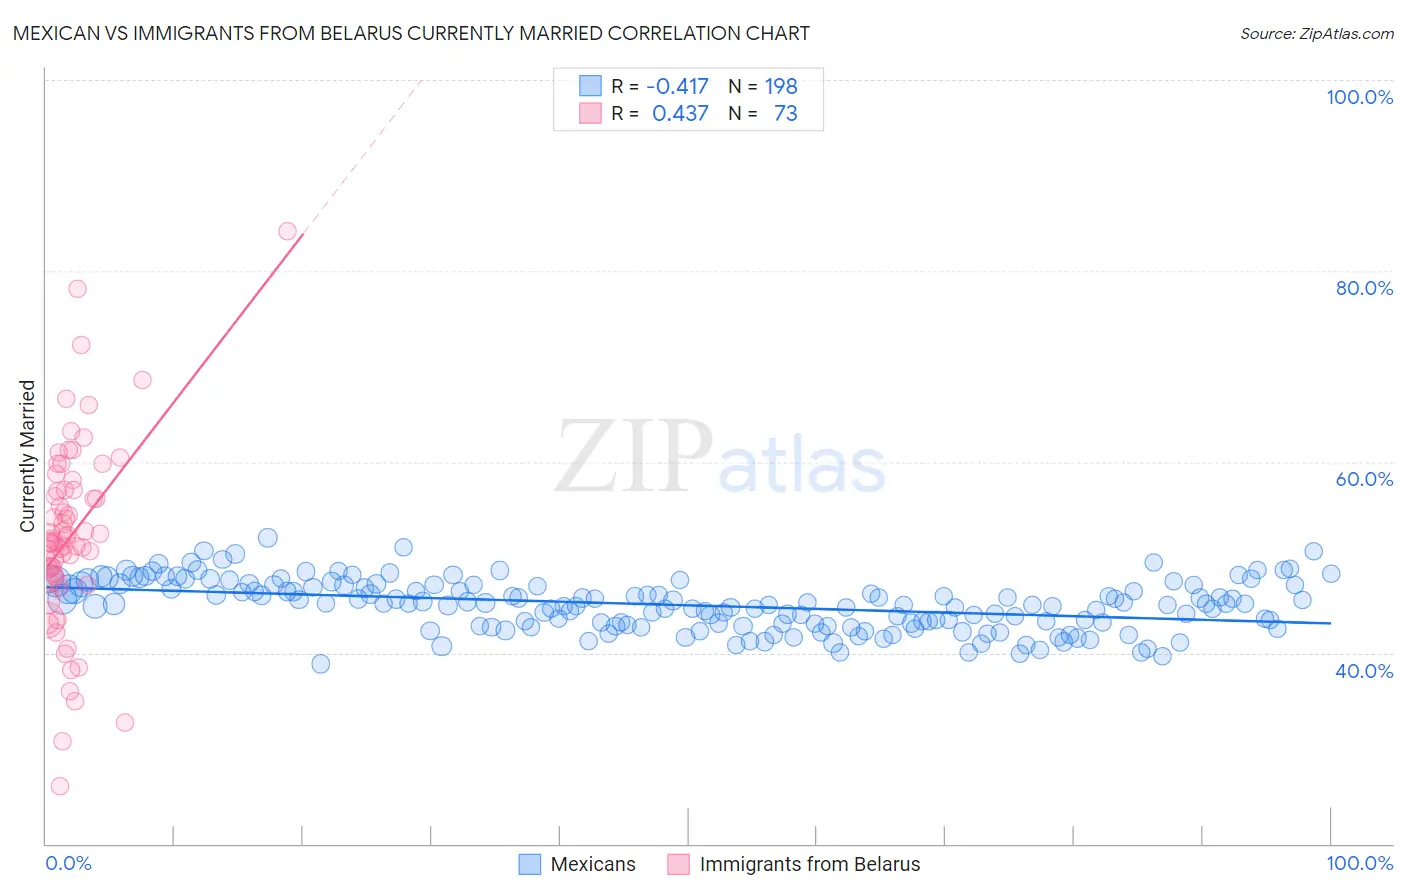
Mexican vs Immigrants from Belarus Currently Married Correlation Chart
The statistical analysis conducted on geographies consisting of 565,159,836 people shows a moderate negative correlation between the proportion of Mexicans and percentage of population currently married in the United States with a correlation coefficient (R) of -0.417 and weighted average of 45.2%. Similarly, the statistical analysis conducted on geographies consisting of 150,199,360 people shows a moderate positive correlation between the proportion of Immigrants from Belarus and percentage of population currently married in the United States with a correlation coefficient (R) of 0.437 and weighted average of 48.1%, a difference of 6.6%.
Currently Married Correlation Summary
| Measurement | Mexican | Immigrants from Belarus |
| Minimum | 38.9% | 26.0% |
| Maximum | 52.1% | 84.2% |
| Range | 13.2% | 58.2% |
| Mean | 45.0% | 52.2% |
| Median | 45.1% | 51.7% |
| Interquartile 25% (IQ1) | 43.0% | 47.7% |
| Interquartile 75% (IQ3) | 47.1% | 57.0% |
| Interquartile Range (IQR) | 4.1% | 9.3% |
| Standard Deviation (Sample) | 2.6% | 9.9% |
| Standard Deviation (Population) | 2.6% | 9.8% |
Similar Demographics by Currently Married
Demographics Similar to Mexicans by Currently Married
In terms of currently married, the demographic groups most similar to Mexicans are Kenyan (45.2%, a difference of 0.020%), Immigrants from Portugal (45.2%, a difference of 0.14%), Immigrants from the Azores (45.1%, a difference of 0.20%), Panamanian (45.3%, a difference of 0.26%), and Immigrants from Laos (45.0%, a difference of 0.28%).
| Demographics | Rating | Rank | Currently Married |
| Dutch West Indians | 6.7 /100 | #214 | Tragic 45.5% |
| German Russians | 6.7 /100 | #215 | Tragic 45.5% |
| Immigrants | Morocco | 5.5 /100 | #216 | Tragic 45.4% |
| Immigrants | Thailand | 5.1 /100 | #217 | Tragic 45.4% |
| Panamanians | 4.0 /100 | #218 | Tragic 45.3% |
| Immigrants | Portugal | 3.5 /100 | #219 | Tragic 45.2% |
| Kenyans | 3.1 /100 | #220 | Tragic 45.2% |
| Mexicans | 3.0 /100 | #221 | Tragic 45.2% |
| Immigrants | Azores | 2.5 /100 | #222 | Tragic 45.1% |
| Immigrants | Laos | 2.3 /100 | #223 | Tragic 45.0% |
| Immigrants | Uganda | 2.2 /100 | #224 | Tragic 45.0% |
| French American Indians | 2.2 /100 | #225 | Tragic 45.0% |
| Comanche | 2.1 /100 | #226 | Tragic 45.0% |
| Spanish Americans | 2.1 /100 | #227 | Tragic 45.0% |
| Immigrants | Uruguay | 2.0 /100 | #228 | Tragic 45.0% |
Demographics Similar to Immigrants from Belarus by Currently Married
In terms of currently married, the demographic groups most similar to Immigrants from Belarus are Basque (48.1%, a difference of 0.020%), Slovene (48.1%, a difference of 0.050%), Immigrants from Belgium (48.1%, a difference of 0.050%), Estonian (48.2%, a difference of 0.070%), and Immigrants from South Africa (48.1%, a difference of 0.070%).
| Demographics | Rating | Rank | Currently Married |
| Immigrants | England | 98.2 /100 | #68 | Exceptional 48.3% |
| Canadians | 98.1 /100 | #69 | Exceptional 48.3% |
| Immigrants | Asia | 97.9 /100 | #70 | Exceptional 48.3% |
| Macedonians | 97.9 /100 | #71 | Exceptional 48.3% |
| Immigrants | Lebanon | 97.6 /100 | #72 | Exceptional 48.2% |
| Immigrants | Eastern Asia | 97.5 /100 | #73 | Exceptional 48.2% |
| Estonians | 97.4 /100 | #74 | Exceptional 48.2% |
| Immigrants | Belarus | 97.2 /100 | #75 | Exceptional 48.1% |
| Basques | 97.2 /100 | #76 | Exceptional 48.1% |
| Slovenes | 97.1 /100 | #77 | Exceptional 48.1% |
| Immigrants | Belgium | 97.1 /100 | #78 | Exceptional 48.1% |
| Immigrants | South Africa | 97.0 /100 | #79 | Exceptional 48.1% |
| Immigrants | Poland | 96.9 /100 | #80 | Exceptional 48.1% |
| Immigrants | Sri Lanka | 96.9 /100 | #81 | Exceptional 48.1% |
| Immigrants | Europe | 96.9 /100 | #82 | Exceptional 48.1% |