Mexican vs Costa Rican Female Unemployment
COMPARE
Mexican
Costa Rican
Female Unemployment
Female Unemployment Comparison
Mexicans
Costa Ricans
6.1%
FEMALE UNEMPLOYMENT
0.0/ 100
METRIC RATING
293rd/ 347
METRIC RANK
5.3%
FEMALE UNEMPLOYMENT
33.8/ 100
METRIC RATING
189th/ 347
METRIC RANK
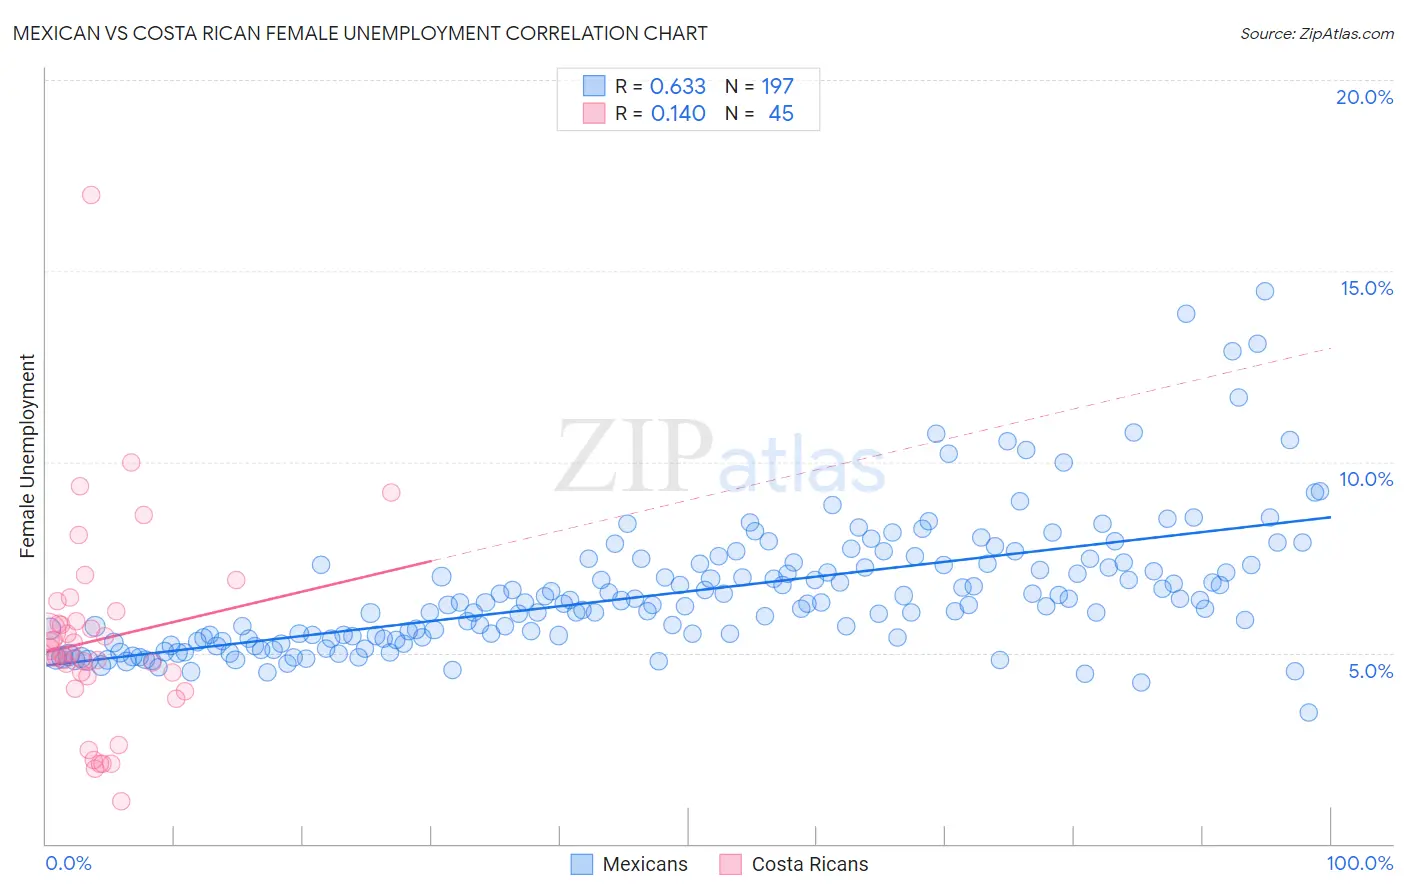
Mexican vs Costa Rican Female Unemployment Correlation Chart
The statistical analysis conducted on geographies consisting of 553,339,596 people shows a significant positive correlation between the proportion of Mexicans and unemploymnet rate among females in the United States with a correlation coefficient (R) of 0.633 and weighted average of 6.1%. Similarly, the statistical analysis conducted on geographies consisting of 253,047,162 people shows a poor positive correlation between the proportion of Costa Ricans and unemploymnet rate among females in the United States with a correlation coefficient (R) of 0.140 and weighted average of 5.3%, a difference of 15.0%.
Female Unemployment Correlation Summary
| Measurement | Mexican | Costa Rican |
| Minimum | 3.4% | 1.1% |
| Maximum | 14.5% | 17.0% |
| Range | 11.0% | 15.9% |
| Mean | 6.6% | 5.4% |
| Median | 6.3% | 5.0% |
| Interquartile 25% (IQ1) | 5.4% | 4.2% |
| Interquartile 75% (IQ3) | 7.3% | 6.0% |
| Interquartile Range (IQR) | 1.9% | 1.7% |
| Standard Deviation (Sample) | 1.8% | 2.7% |
| Standard Deviation (Population) | 1.8% | 2.6% |
Similar Demographics by Female Unemployment
Demographics Similar to Mexicans by Female Unemployment
In terms of female unemployment, the demographic groups most similar to Mexicans are Immigrants from Trinidad and Tobago (6.1%, a difference of 0.080%), Immigrants from El Salvador (6.1%, a difference of 0.10%), Immigrants from West Indies (6.1%, a difference of 0.15%), Immigrants from Latin America (6.1%, a difference of 0.20%), and Alaskan Athabascan (6.1%, a difference of 0.22%).
| Demographics | Rating | Rank | Female Unemployment |
| Chippewa | 0.0 /100 | #286 | Tragic 6.1% |
| Immigrants | Guatemala | 0.0 /100 | #287 | Tragic 6.1% |
| Haitians | 0.0 /100 | #288 | Tragic 6.1% |
| Trinidadians and Tobagonians | 0.0 /100 | #289 | Tragic 6.1% |
| Immigrants | Caribbean | 0.0 /100 | #290 | Tragic 6.1% |
| Immigrants | West Indies | 0.0 /100 | #291 | Tragic 6.1% |
| Immigrants | Trinidad and Tobago | 0.0 /100 | #292 | Tragic 6.1% |
| Mexicans | 0.0 /100 | #293 | Tragic 6.1% |
| Immigrants | El Salvador | 0.0 /100 | #294 | Tragic 6.1% |
| Immigrants | Latin America | 0.0 /100 | #295 | Tragic 6.1% |
| Alaskan Athabascans | 0.0 /100 | #296 | Tragic 6.1% |
| West Indians | 0.0 /100 | #297 | Tragic 6.1% |
| Jamaicans | 0.0 /100 | #298 | Tragic 6.1% |
| Ute | 0.0 /100 | #299 | Tragic 6.1% |
| Immigrants | Haiti | 0.0 /100 | #300 | Tragic 6.1% |
Demographics Similar to Costa Ricans by Female Unemployment
In terms of female unemployment, the demographic groups most similar to Costa Ricans are Afghan (5.3%, a difference of 0.0%), Immigrants from Albania (5.3%, a difference of 0.10%), Ugandan (5.3%, a difference of 0.18%), Cherokee (5.3%, a difference of 0.20%), and Immigrants from Belarus (5.3%, a difference of 0.36%).
| Demographics | Rating | Rank | Female Unemployment |
| Immigrants | Nonimmigrants | 42.6 /100 | #182 | Average 5.3% |
| Immigrants | Indonesia | 40.7 /100 | #183 | Average 5.3% |
| Immigrants | Ukraine | 40.1 /100 | #184 | Average 5.3% |
| Malaysians | 40.1 /100 | #185 | Average 5.3% |
| Immigrants | Belarus | 39.4 /100 | #186 | Fair 5.3% |
| Immigrants | Albania | 35.4 /100 | #187 | Fair 5.3% |
| Afghans | 33.9 /100 | #188 | Fair 5.3% |
| Costa Ricans | 33.8 /100 | #189 | Fair 5.3% |
| Ugandans | 31.2 /100 | #190 | Fair 5.3% |
| Cherokee | 30.8 /100 | #191 | Fair 5.3% |
| Portuguese | 28.6 /100 | #192 | Fair 5.3% |
| Arabs | 27.7 /100 | #193 | Fair 5.3% |
| Colombians | 27.0 /100 | #194 | Fair 5.3% |
| Immigrants | Colombia | 26.2 /100 | #195 | Fair 5.3% |
| Spaniards | 25.2 /100 | #196 | Fair 5.3% |