Mexican vs Hmong Currently Married
COMPARE
Mexican
Hmong
Currently Married
Currently Married Comparison
Mexicans
Hmong
45.2%
CURRENTLY MARRIED
3.0/ 100
METRIC RATING
221st/ 347
METRIC RANK
47.1%
CURRENTLY MARRIED
73.4/ 100
METRIC RATING
144th/ 347
METRIC RANK
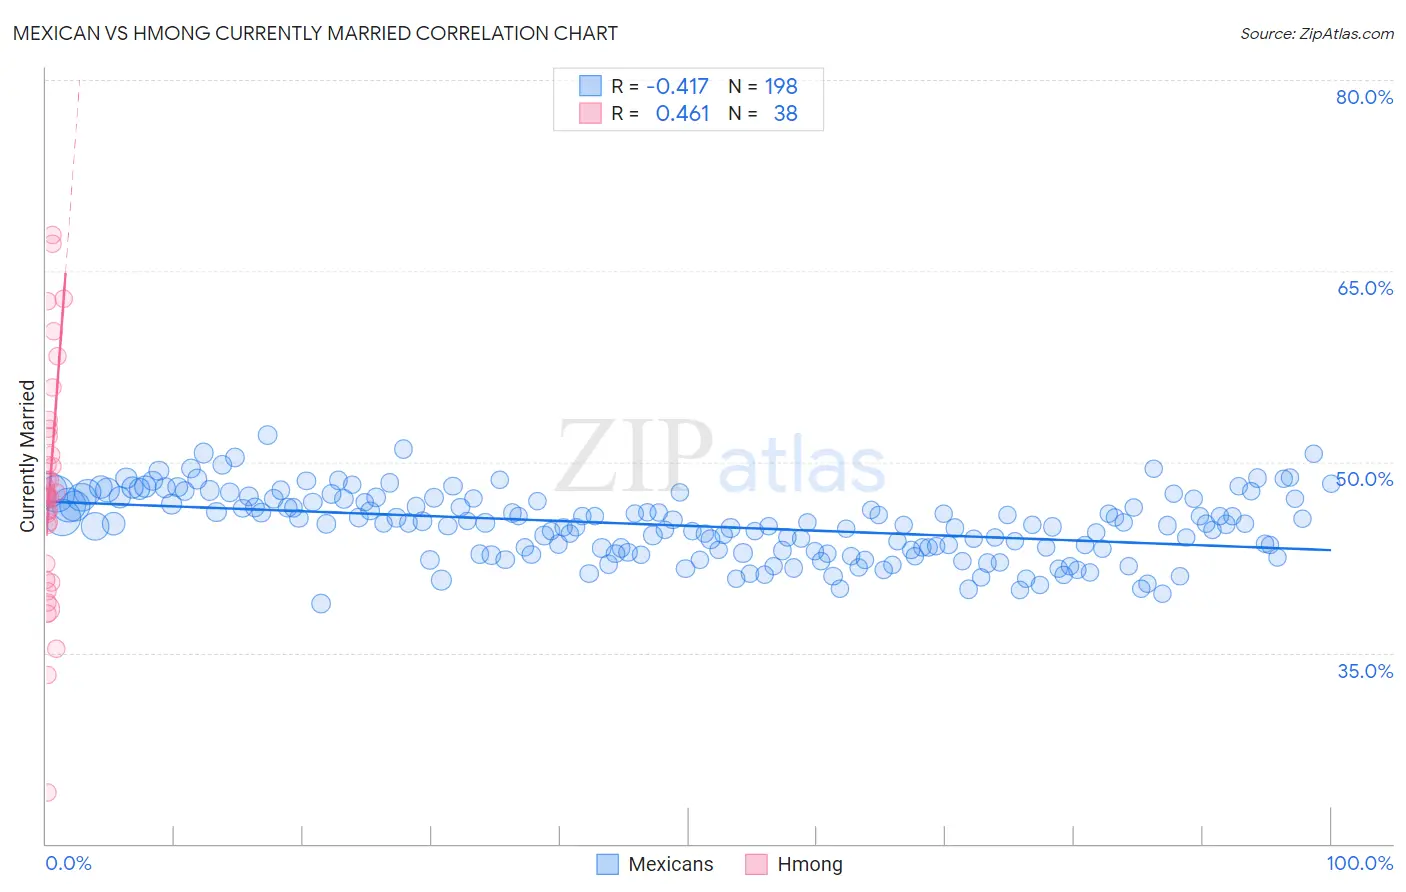
Mexican vs Hmong Currently Married Correlation Chart
The statistical analysis conducted on geographies consisting of 565,159,836 people shows a moderate negative correlation between the proportion of Mexicans and percentage of population currently married in the United States with a correlation coefficient (R) of -0.417 and weighted average of 45.2%. Similarly, the statistical analysis conducted on geographies consisting of 24,669,739 people shows a moderate positive correlation between the proportion of Hmong and percentage of population currently married in the United States with a correlation coefficient (R) of 0.461 and weighted average of 47.1%, a difference of 4.2%.
Currently Married Correlation Summary
| Measurement | Mexican | Hmong |
| Minimum | 38.9% | 24.0% |
| Maximum | 52.1% | 67.8% |
| Range | 13.2% | 43.8% |
| Mean | 45.0% | 47.9% |
| Median | 45.1% | 47.4% |
| Interquartile 25% (IQ1) | 43.0% | 42.0% |
| Interquartile 75% (IQ3) | 47.1% | 52.0% |
| Interquartile Range (IQR) | 4.1% | 10.0% |
| Standard Deviation (Sample) | 2.6% | 9.1% |
| Standard Deviation (Population) | 2.6% | 9.0% |
Similar Demographics by Currently Married
Demographics Similar to Mexicans by Currently Married
In terms of currently married, the demographic groups most similar to Mexicans are Kenyan (45.2%, a difference of 0.020%), Immigrants from Portugal (45.2%, a difference of 0.14%), Immigrants from the Azores (45.1%, a difference of 0.20%), Panamanian (45.3%, a difference of 0.26%), and Immigrants from Laos (45.0%, a difference of 0.28%).
| Demographics | Rating | Rank | Currently Married |
| Dutch West Indians | 6.7 /100 | #214 | Tragic 45.5% |
| German Russians | 6.7 /100 | #215 | Tragic 45.5% |
| Immigrants | Morocco | 5.5 /100 | #216 | Tragic 45.4% |
| Immigrants | Thailand | 5.1 /100 | #217 | Tragic 45.4% |
| Panamanians | 4.0 /100 | #218 | Tragic 45.3% |
| Immigrants | Portugal | 3.5 /100 | #219 | Tragic 45.2% |
| Kenyans | 3.1 /100 | #220 | Tragic 45.2% |
| Mexicans | 3.0 /100 | #221 | Tragic 45.2% |
| Immigrants | Azores | 2.5 /100 | #222 | Tragic 45.1% |
| Immigrants | Laos | 2.3 /100 | #223 | Tragic 45.0% |
| Immigrants | Uganda | 2.2 /100 | #224 | Tragic 45.0% |
| French American Indians | 2.2 /100 | #225 | Tragic 45.0% |
| Comanche | 2.1 /100 | #226 | Tragic 45.0% |
| Spanish Americans | 2.1 /100 | #227 | Tragic 45.0% |
| Immigrants | Uruguay | 2.0 /100 | #228 | Tragic 45.0% |
Demographics Similar to Hmong by Currently Married
In terms of currently married, the demographic groups most similar to Hmong are Immigrants from South Eastern Asia (47.1%, a difference of 0.030%), Argentinean (47.1%, a difference of 0.040%), Guamanian/Chamorro (47.1%, a difference of 0.040%), Carpatho Rusyn (47.0%, a difference of 0.040%), and Venezuelan (47.1%, a difference of 0.050%).
| Demographics | Rating | Rank | Currently Married |
| Paraguayans | 77.8 /100 | #137 | Good 47.2% |
| Pakistanis | 77.5 /100 | #138 | Good 47.2% |
| Yugoslavians | 77.4 /100 | #139 | Good 47.2% |
| Cajuns | 75.3 /100 | #140 | Good 47.1% |
| Venezuelans | 74.4 /100 | #141 | Good 47.1% |
| Argentineans | 74.4 /100 | #142 | Good 47.1% |
| Guamanians/Chamorros | 74.2 /100 | #143 | Good 47.1% |
| Hmong | 73.4 /100 | #144 | Good 47.1% |
| Immigrants | South Eastern Asia | 72.9 /100 | #145 | Good 47.1% |
| Carpatho Rusyns | 72.6 /100 | #146 | Good 47.0% |
| Immigrants | Argentina | 72.0 /100 | #147 | Good 47.0% |
| Cambodians | 70.4 /100 | #148 | Good 47.0% |
| Zimbabweans | 70.1 /100 | #149 | Good 47.0% |
| Immigrants | Turkey | 70.0 /100 | #150 | Good 47.0% |
| Chileans | 69.8 /100 | #151 | Good 47.0% |