Mexican vs Immigrants from Spain Currently Married
COMPARE
Mexican
Immigrants from Spain
Currently Married
Currently Married Comparison
Mexicans
Immigrants from Spain
45.2%
CURRENTLY MARRIED
3.0/ 100
METRIC RATING
221st/ 347
METRIC RANK
45.8%
CURRENTLY MARRIED
11.6/ 100
METRIC RATING
204th/ 347
METRIC RANK
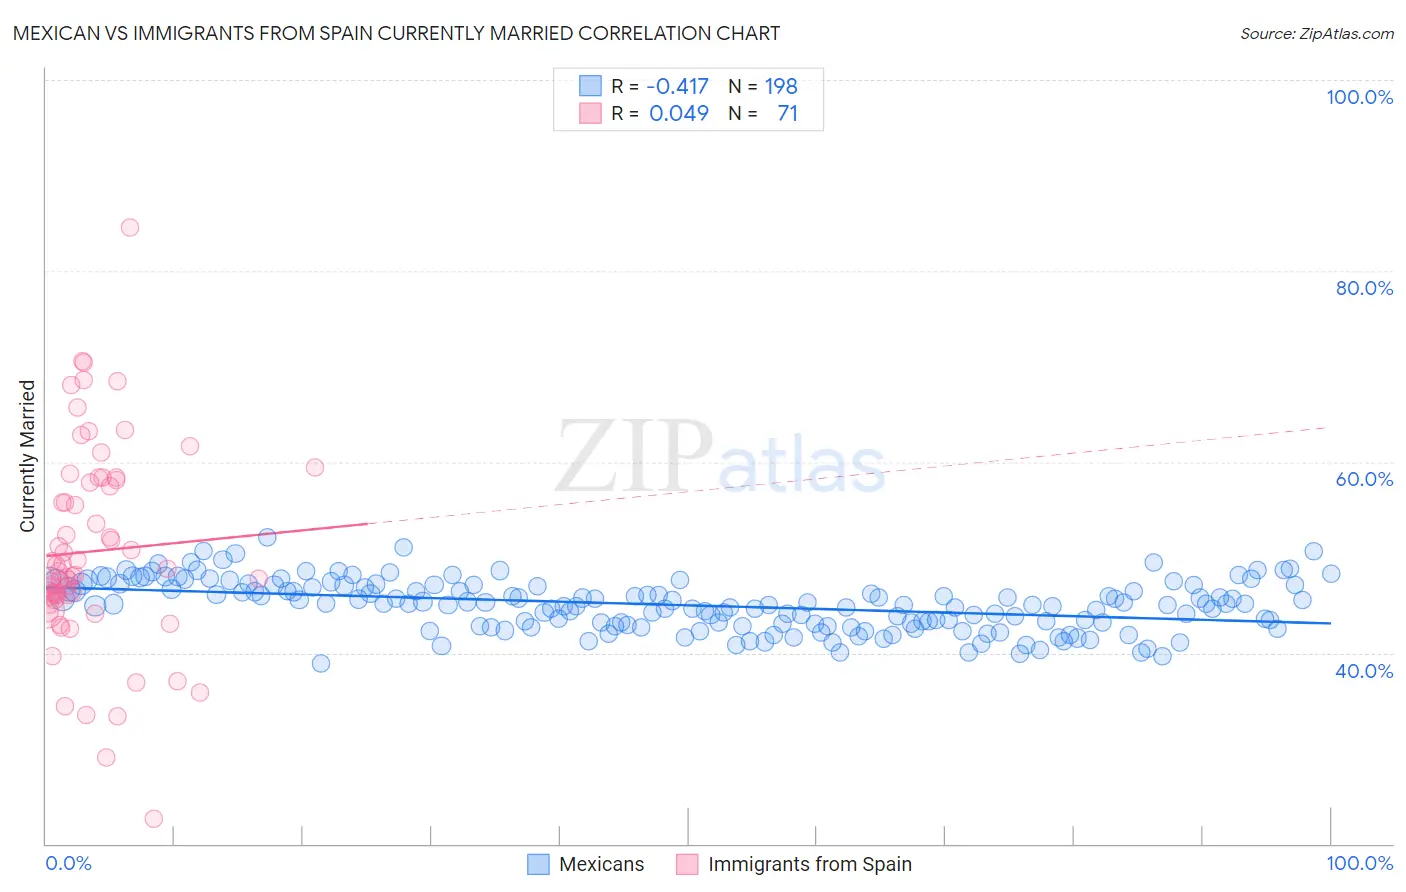
Mexican vs Immigrants from Spain Currently Married Correlation Chart
The statistical analysis conducted on geographies consisting of 565,159,836 people shows a moderate negative correlation between the proportion of Mexicans and percentage of population currently married in the United States with a correlation coefficient (R) of -0.417 and weighted average of 45.2%. Similarly, the statistical analysis conducted on geographies consisting of 239,655,163 people shows no correlation between the proportion of Immigrants from Spain and percentage of population currently married in the United States with a correlation coefficient (R) of 0.049 and weighted average of 45.8%, a difference of 1.4%.
Currently Married Correlation Summary
| Measurement | Mexican | Immigrants from Spain |
| Minimum | 38.9% | 22.6% |
| Maximum | 52.1% | 84.5% |
| Range | 13.2% | 61.9% |
| Mean | 45.0% | 50.6% |
| Median | 45.1% | 48.6% |
| Interquartile 25% (IQ1) | 43.0% | 45.5% |
| Interquartile 75% (IQ3) | 47.1% | 58.1% |
| Interquartile Range (IQR) | 4.1% | 12.6% |
| Standard Deviation (Sample) | 2.6% | 10.6% |
| Standard Deviation (Population) | 2.6% | 10.5% |
Demographics Similar to Mexicans and Immigrants from Spain by Currently Married
In terms of currently married, the demographic groups most similar to Mexicans are Kenyan (45.2%, a difference of 0.020%), Immigrants from Portugal (45.2%, a difference of 0.14%), Immigrants from the Azores (45.1%, a difference of 0.20%), Panamanian (45.3%, a difference of 0.26%), and Immigrants from Thailand (45.4%, a difference of 0.50%). Similarly, the demographic groups most similar to Immigrants from Spain are Taiwanese (45.8%, a difference of 0.010%), South American Indian (45.8%, a difference of 0.020%), Immigrants (45.8%, a difference of 0.040%), Immigrants from South America (45.7%, a difference of 0.080%), and Alsatian (45.7%, a difference of 0.080%).
| Demographics | Rating | Rank | Currently Married |
| Immigrants | Albania | 14.5 /100 | #202 | Poor 45.9% |
| Taiwanese | 11.7 /100 | #203 | Poor 45.8% |
| Immigrants | Spain | 11.6 /100 | #204 | Poor 45.8% |
| South American Indians | 11.5 /100 | #205 | Poor 45.8% |
| Immigrants | Immigrants | 11.2 /100 | #206 | Poor 45.8% |
| Immigrants | South America | 10.8 /100 | #207 | Poor 45.7% |
| Alsatians | 10.8 /100 | #208 | Poor 45.7% |
| Immigrants | Micronesia | 8.8 /100 | #209 | Tragic 45.6% |
| Uruguayans | 7.9 /100 | #210 | Tragic 45.6% |
| Houma | 7.2 /100 | #211 | Tragic 45.5% |
| Marshallese | 7.2 /100 | #212 | Tragic 45.5% |
| Alaska Natives | 7.0 /100 | #213 | Tragic 45.5% |
| Dutch West Indians | 6.7 /100 | #214 | Tragic 45.5% |
| German Russians | 6.7 /100 | #215 | Tragic 45.5% |
| Immigrants | Morocco | 5.5 /100 | #216 | Tragic 45.4% |
| Immigrants | Thailand | 5.1 /100 | #217 | Tragic 45.4% |
| Panamanians | 4.0 /100 | #218 | Tragic 45.3% |
| Immigrants | Portugal | 3.5 /100 | #219 | Tragic 45.2% |
| Kenyans | 3.1 /100 | #220 | Tragic 45.2% |
| Mexicans | 3.0 /100 | #221 | Tragic 45.2% |
| Immigrants | Azores | 2.5 /100 | #222 | Tragic 45.1% |