Menominee vs Luxembourger Single Father Households
COMPARE
Menominee
Luxembourger
Single Father Households
Single Father Households Comparison
Menominee
Luxembourgers
4.2%
SINGLE FATHER HOUSEHOLDS
0.0/ 100
METRIC RATING
345th/ 347
METRIC RANK
2.2%
SINGLE FATHER HOUSEHOLDS
92.3/ 100
METRIC RATING
142nd/ 347
METRIC RANK
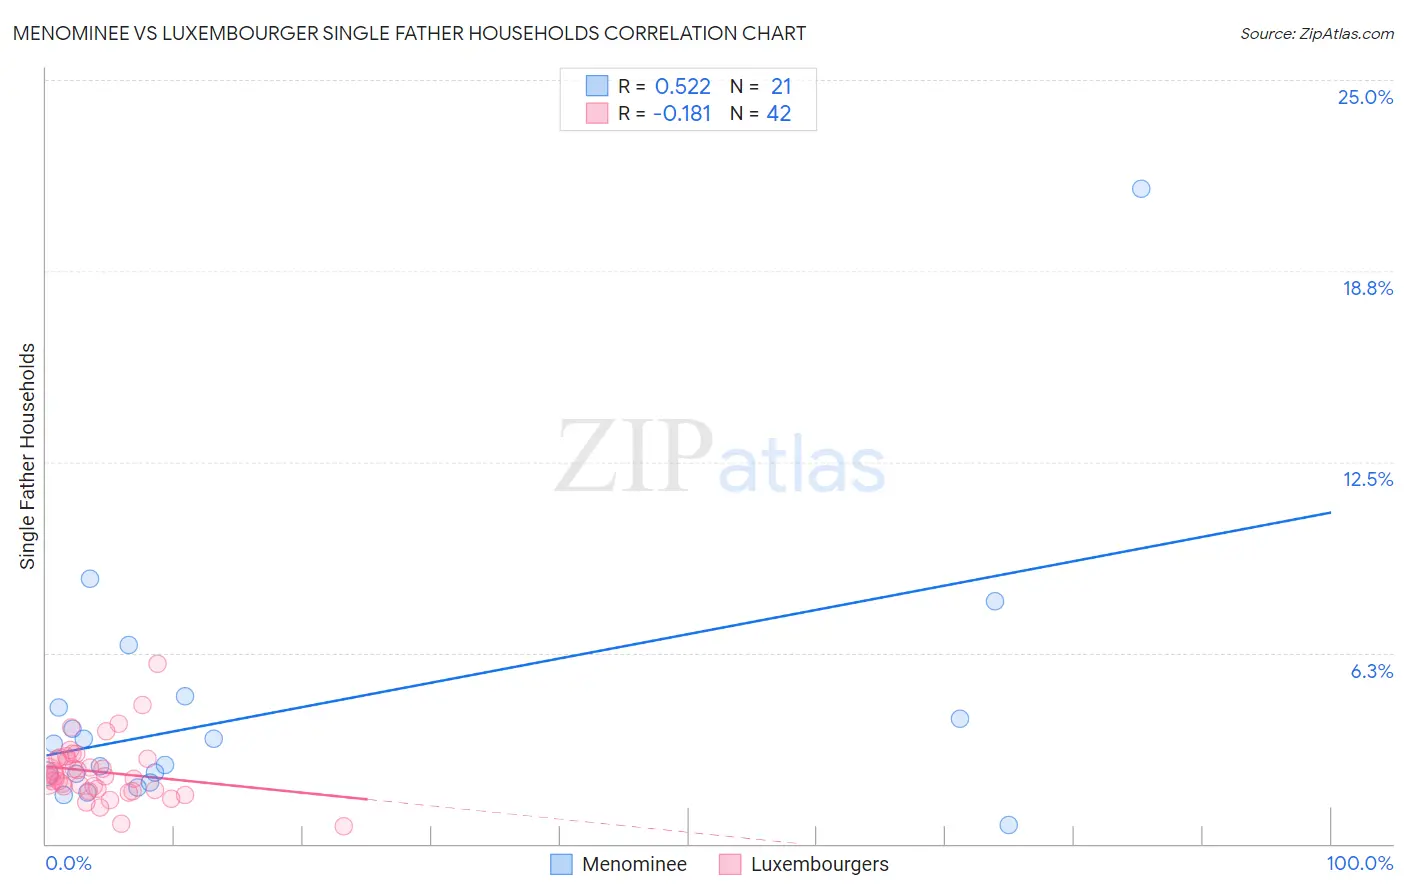
Menominee vs Luxembourger Single Father Households Correlation Chart
The statistical analysis conducted on geographies consisting of 45,722,024 people shows a substantial positive correlation between the proportion of Menominee and percentage of single father households in the United States with a correlation coefficient (R) of 0.522 and weighted average of 4.2%. Similarly, the statistical analysis conducted on geographies consisting of 143,992,670 people shows a poor negative correlation between the proportion of Luxembourgers and percentage of single father households in the United States with a correlation coefficient (R) of -0.181 and weighted average of 2.2%, a difference of 88.9%.
Single Father Households Correlation Summary
| Measurement | Menominee | Luxembourger |
| Minimum | 0.60% | 0.55% |
| Maximum | 21.4% | 5.9% |
| Range | 20.8% | 5.3% |
| Mean | 4.4% | 2.4% |
| Median | 3.3% | 2.2% |
| Interquartile 25% (IQ1) | 2.1% | 1.8% |
| Interquartile 75% (IQ3) | 4.7% | 2.8% |
| Interquartile Range (IQR) | 2.5% | 1.0% |
| Standard Deviation (Sample) | 4.4% | 0.98% |
| Standard Deviation (Population) | 4.3% | 0.97% |
Similar Demographics by Single Father Households
Demographics Similar to Menominee by Single Father Households
In terms of single father households, the demographic groups most similar to Menominee are Yakama (4.2%, a difference of 0.69%), Pima (4.2%, a difference of 0.93%), Tohono O'odham (3.8%, a difference of 10.2%), Inupiat (4.9%, a difference of 15.3%), and Crow (3.5%, a difference of 19.9%).
| Demographics | Rating | Rank | Single Father Households |
| Natives/Alaskans | 0.0 /100 | #333 | Tragic 3.2% |
| Yuman | 0.0 /100 | #334 | Tragic 3.3% |
| Colville | 0.0 /100 | #335 | Tragic 3.3% |
| Paiute | 0.0 /100 | #336 | Tragic 3.3% |
| Pueblo | 0.0 /100 | #337 | Tragic 3.3% |
| Sioux | 0.0 /100 | #338 | Tragic 3.3% |
| Alaskan Athabascans | 0.0 /100 | #339 | Tragic 3.4% |
| Alaska Natives | 0.0 /100 | #340 | Tragic 3.5% |
| Crow | 0.0 /100 | #341 | Tragic 3.5% |
| Tohono O'odham | 0.0 /100 | #342 | Tragic 3.8% |
| Pima | 0.0 /100 | #343 | Tragic 4.2% |
| Yakama | 0.0 /100 | #344 | Tragic 4.2% |
| Menominee | 0.0 /100 | #345 | Tragic 4.2% |
| Inupiat | 0.0 /100 | #346 | Tragic 4.9% |
| Yup'ik | 0.0 /100 | #347 | Tragic 5.4% |
Demographics Similar to Luxembourgers by Single Father Households
In terms of single father households, the demographic groups most similar to Luxembourgers are Laotian (2.2%, a difference of 0.040%), Immigrants from Nepal (2.2%, a difference of 0.060%), Brazilian (2.2%, a difference of 0.13%), British (2.2%, a difference of 0.13%), and Slovak (2.2%, a difference of 0.40%).
| Demographics | Rating | Rank | Single Father Households |
| Syrians | 94.8 /100 | #135 | Exceptional 2.2% |
| Chileans | 94.5 /100 | #136 | Exceptional 2.2% |
| Austrians | 94.2 /100 | #137 | Exceptional 2.2% |
| West Indians | 94.1 /100 | #138 | Exceptional 2.2% |
| Brazilians | 92.8 /100 | #139 | Exceptional 2.2% |
| British | 92.8 /100 | #140 | Exceptional 2.2% |
| Laotians | 92.5 /100 | #141 | Exceptional 2.2% |
| Luxembourgers | 92.3 /100 | #142 | Exceptional 2.2% |
| Immigrants | Nepal | 92.1 /100 | #143 | Exceptional 2.2% |
| Slovaks | 90.7 /100 | #144 | Exceptional 2.2% |
| Immigrants | Zimbabwe | 90.2 /100 | #145 | Exceptional 2.2% |
| Northern Europeans | 89.8 /100 | #146 | Excellent 2.2% |
| Slavs | 88.9 /100 | #147 | Excellent 2.2% |
| South American Indians | 88.5 /100 | #148 | Excellent 2.3% |
| Senegalese | 88.4 /100 | #149 | Excellent 2.3% |