Menominee vs Alaska Native Married-couple Households
COMPARE
Menominee
Alaska Native
Married-couple Households
Married-couple Households Comparison
Menominee
Alaska Natives
42.0%
MARRIED-COUPLE HOUSEHOLDS
0.0/ 100
METRIC RATING
293rd/ 347
METRIC RANK
45.6%
MARRIED-COUPLE HOUSEHOLDS
13.0/ 100
METRIC RATING
203rd/ 347
METRIC RANK
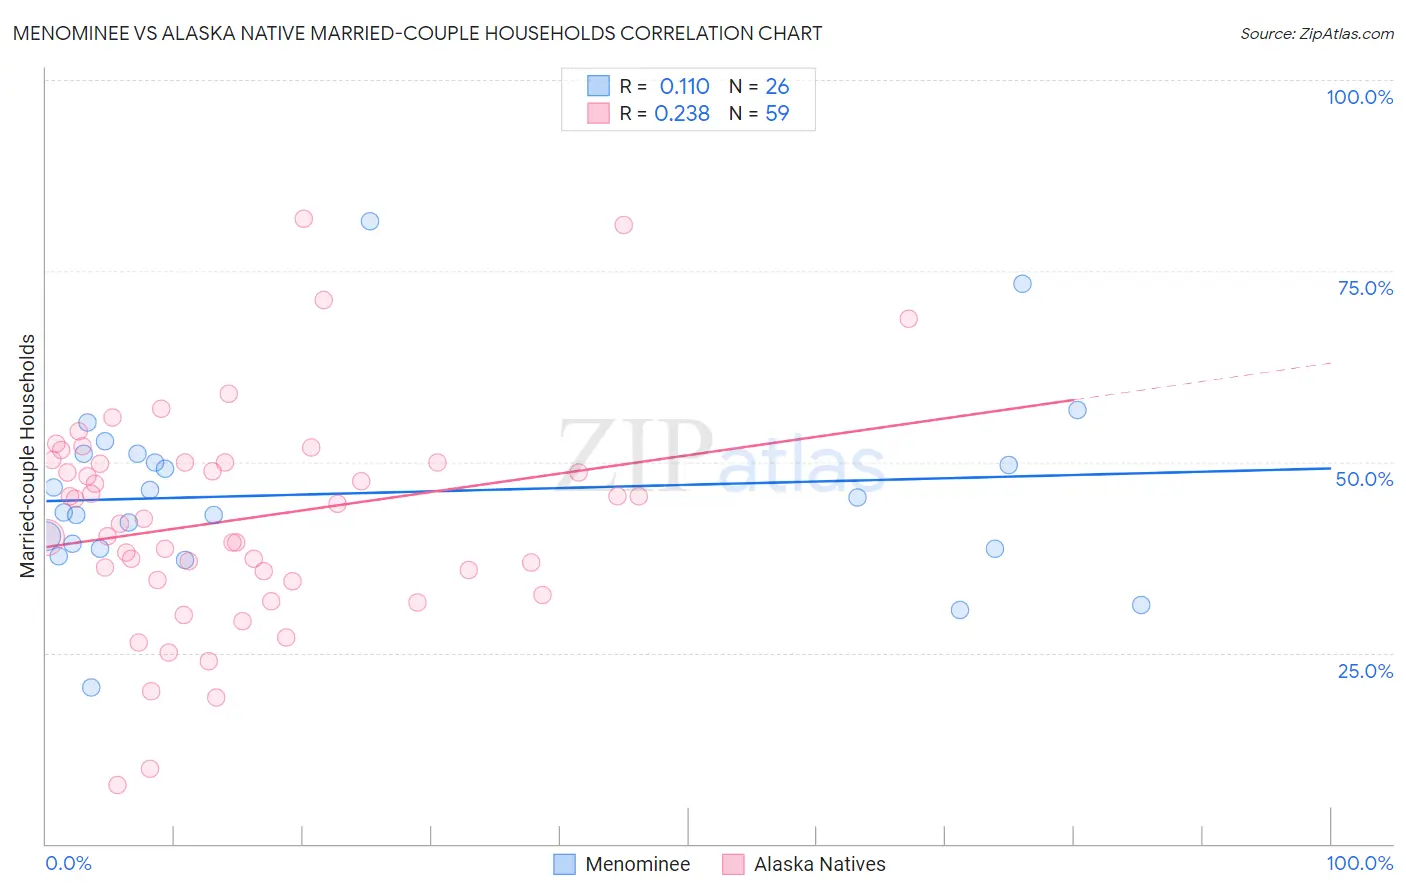
Menominee vs Alaska Native Married-couple Households Correlation Chart
The statistical analysis conducted on geographies consisting of 45,777,849 people shows a poor positive correlation between the proportion of Menominee and percentage of married-couple family households in the United States with a correlation coefficient (R) of 0.110 and weighted average of 42.0%. Similarly, the statistical analysis conducted on geographies consisting of 76,754,509 people shows a weak positive correlation between the proportion of Alaska Natives and percentage of married-couple family households in the United States with a correlation coefficient (R) of 0.238 and weighted average of 45.6%, a difference of 8.6%.
Married-couple Households Correlation Summary
| Measurement | Menominee | Alaska Native |
| Minimum | 20.5% | 7.7% |
| Maximum | 81.5% | 81.8% |
| Range | 61.0% | 74.1% |
| Mean | 45.9% | 42.5% |
| Median | 44.3% | 42.6% |
| Interquartile 25% (IQ1) | 38.6% | 34.6% |
| Interquartile 75% (IQ3) | 51.0% | 50.0% |
| Interquartile Range (IQR) | 12.4% | 15.4% |
| Standard Deviation (Sample) | 12.4% | 14.3% |
| Standard Deviation (Population) | 12.1% | 14.1% |
Similar Demographics by Married-couple Households
Demographics Similar to Menominee by Married-couple Households
In terms of married-couple households, the demographic groups most similar to Menominee are Immigrants from Yemen (42.0%, a difference of 0.0%), Kiowa (42.0%, a difference of 0.0%), Indonesian (42.0%, a difference of 0.11%), Immigrants from Sudan (41.9%, a difference of 0.11%), and Paiute (42.1%, a difference of 0.16%).
| Demographics | Rating | Rank | Married-couple Households |
| Belizeans | 0.0 /100 | #286 | Tragic 42.2% |
| Chippewa | 0.0 /100 | #287 | Tragic 42.1% |
| Immigrants | Eritrea | 0.0 /100 | #288 | Tragic 42.1% |
| Sudanese | 0.0 /100 | #289 | Tragic 42.1% |
| Hondurans | 0.0 /100 | #290 | Tragic 42.1% |
| Paiute | 0.0 /100 | #291 | Tragic 42.1% |
| Indonesians | 0.0 /100 | #292 | Tragic 42.0% |
| Menominee | 0.0 /100 | #293 | Tragic 42.0% |
| Immigrants | Yemen | 0.0 /100 | #294 | Tragic 42.0% |
| Kiowa | 0.0 /100 | #295 | Tragic 42.0% |
| Immigrants | Sudan | 0.0 /100 | #296 | Tragic 41.9% |
| Arapaho | 0.0 /100 | #297 | Tragic 41.8% |
| Immigrants | Middle Africa | 0.0 /100 | #298 | Tragic 41.8% |
| Immigrants | Ghana | 0.0 /100 | #299 | Tragic 41.8% |
| Immigrants | Belize | 0.0 /100 | #300 | Tragic 41.8% |
Demographics Similar to Alaska Natives by Married-couple Households
In terms of married-couple households, the demographic groups most similar to Alaska Natives are Aleut (45.6%, a difference of 0.050%), Immigrants from Central America (45.7%, a difference of 0.090%), Nepalese (45.6%, a difference of 0.10%), Immigrants from Serbia (45.7%, a difference of 0.17%), and Potawatomi (45.7%, a difference of 0.20%).
| Demographics | Rating | Rank | Married-couple Households |
| Immigrants | South America | 22.2 /100 | #196 | Fair 45.9% |
| Cambodians | 21.3 /100 | #197 | Fair 45.9% |
| Ottawa | 19.4 /100 | #198 | Poor 45.8% |
| Carpatho Rusyns | 15.7 /100 | #199 | Poor 45.7% |
| Potawatomi | 15.6 /100 | #200 | Poor 45.7% |
| Immigrants | Serbia | 15.2 /100 | #201 | Poor 45.7% |
| Immigrants | Central America | 14.2 /100 | #202 | Poor 45.7% |
| Alaska Natives | 13.0 /100 | #203 | Poor 45.6% |
| Aleuts | 12.5 /100 | #204 | Poor 45.6% |
| Nepalese | 11.9 /100 | #205 | Poor 45.6% |
| Uruguayans | 10.4 /100 | #206 | Poor 45.5% |
| Immigrants | France | 8.8 /100 | #207 | Tragic 45.4% |
| Hispanics or Latinos | 8.7 /100 | #208 | Tragic 45.4% |
| Immigrants | Uzbekistan | 8.4 /100 | #209 | Tragic 45.4% |
| Cubans | 7.7 /100 | #210 | Tragic 45.4% |