Marshallese vs Czechoslovakian Single Father Households
COMPARE
Marshallese
Czechoslovakian
Single Father Households
Single Father Households Comparison
Marshallese
Czechoslovakians
2.4%
SINGLE FATHER HOUSEHOLDS
9.7/ 100
METRIC RATING
225th/ 347
METRIC RANK
2.3%
SINGLE FATHER HOUSEHOLDS
58.9/ 100
METRIC RATING
172nd/ 347
METRIC RANK
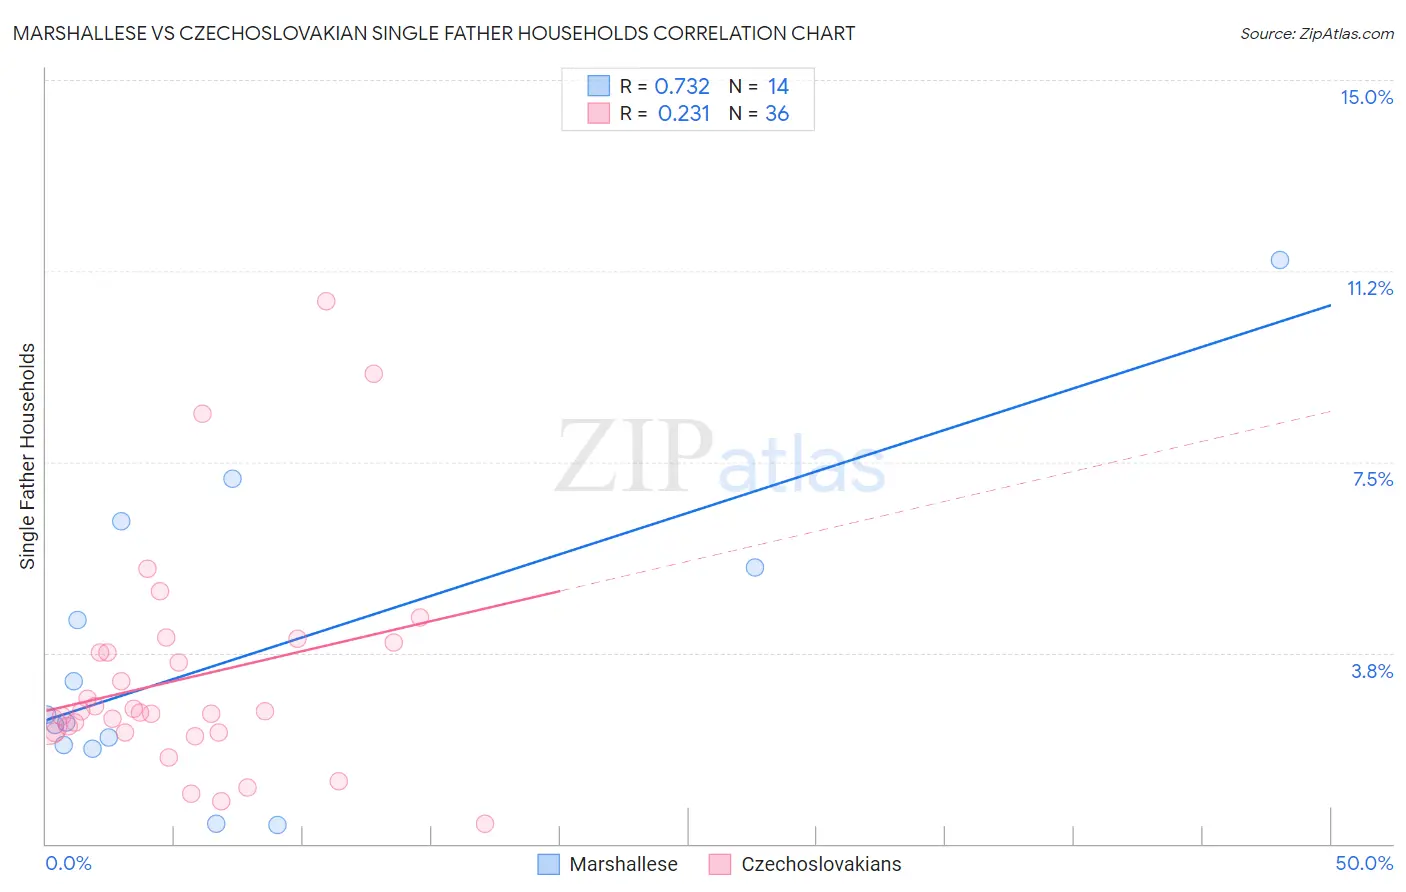
Marshallese vs Czechoslovakian Single Father Households Correlation Chart
The statistical analysis conducted on geographies consisting of 14,759,622 people shows a strong positive correlation between the proportion of Marshallese and percentage of single father households in the United States with a correlation coefficient (R) of 0.732 and weighted average of 2.4%. Similarly, the statistical analysis conducted on geographies consisting of 365,345,214 people shows a weak positive correlation between the proportion of Czechoslovakians and percentage of single father households in the United States with a correlation coefficient (R) of 0.231 and weighted average of 2.3%, a difference of 4.8%.
Single Father Households Correlation Summary
| Measurement | Marshallese | Czechoslovakian |
| Minimum | 0.37% | 0.39% |
| Maximum | 11.5% | 10.7% |
| Range | 11.1% | 10.3% |
| Mean | 3.7% | 3.3% |
| Median | 2.5% | 2.6% |
| Interquartile 25% (IQ1) | 1.9% | 2.2% |
| Interquartile 75% (IQ3) | 5.4% | 3.9% |
| Interquartile Range (IQR) | 3.5% | 1.7% |
| Standard Deviation (Sample) | 3.0% | 2.2% |
| Standard Deviation (Population) | 2.9% | 2.2% |
Similar Demographics by Single Father Households
Demographics Similar to Marshallese by Single Father Households
In terms of single father households, the demographic groups most similar to Marshallese are Black/African American (2.4%, a difference of 0.010%), American (2.4%, a difference of 0.080%), Immigrants from Ghana (2.4%, a difference of 0.12%), Immigrants from Bahamas (2.4%, a difference of 0.17%), and Immigrants from Zaire (2.4%, a difference of 0.23%).
| Demographics | Rating | Rank | Single Father Households |
| Immigrants | Ethiopia | 13.4 /100 | #218 | Poor 2.4% |
| Sudanese | 13.0 /100 | #219 | Poor 2.4% |
| Ghanaians | 12.9 /100 | #220 | Poor 2.4% |
| Immigrants | Burma/Myanmar | 12.1 /100 | #221 | Poor 2.4% |
| Immigrants | Eastern Africa | 11.9 /100 | #222 | Poor 2.4% |
| Immigrants | Uruguay | 11.0 /100 | #223 | Poor 2.4% |
| Immigrants | Bahamas | 10.6 /100 | #224 | Poor 2.4% |
| Marshallese | 9.7 /100 | #225 | Tragic 2.4% |
| Blacks/African Americans | 9.7 /100 | #226 | Tragic 2.4% |
| Americans | 9.3 /100 | #227 | Tragic 2.4% |
| Immigrants | Ghana | 9.1 /100 | #228 | Tragic 2.4% |
| Immigrants | Zaire | 8.6 /100 | #229 | Tragic 2.4% |
| Sub-Saharan Africans | 8.3 /100 | #230 | Tragic 2.4% |
| Immigrants | Nonimmigrants | 7.6 /100 | #231 | Tragic 2.4% |
| Pennsylvania Germans | 7.3 /100 | #232 | Tragic 2.4% |
Demographics Similar to Czechoslovakians by Single Father Households
In terms of single father households, the demographic groups most similar to Czechoslovakians are Swedish (2.3%, a difference of 0.21%), Ugandan (2.3%, a difference of 0.26%), Celtic (2.3%, a difference of 0.26%), Czech (2.3%, a difference of 0.29%), and Icelander (2.3%, a difference of 0.33%).
| Demographics | Rating | Rank | Single Father Households |
| Scotch-Irish | 69.4 /100 | #165 | Good 2.3% |
| English | 68.6 /100 | #166 | Good 2.3% |
| South Americans | 64.3 /100 | #167 | Good 2.3% |
| Icelanders | 63.1 /100 | #168 | Good 2.3% |
| Czechs | 62.5 /100 | #169 | Good 2.3% |
| Ugandans | 62.2 /100 | #170 | Good 2.3% |
| Swedes | 61.6 /100 | #171 | Good 2.3% |
| Czechoslovakians | 58.9 /100 | #172 | Average 2.3% |
| Celtics | 55.4 /100 | #173 | Average 2.3% |
| Afghans | 50.0 /100 | #174 | Average 2.3% |
| Immigrants | Jamaica | 49.1 /100 | #175 | Average 2.3% |
| Danes | 48.2 /100 | #176 | Average 2.3% |
| Colombians | 48.0 /100 | #177 | Average 2.3% |
| Costa Ricans | 44.1 /100 | #178 | Average 2.3% |
| Welsh | 44.0 /100 | #179 | Average 2.3% |