Marshallese vs New Zealander Single Father Households
COMPARE
Marshallese
New Zealander
Single Father Households
Single Father Households Comparison
Marshallese
New Zealanders
2.4%
SINGLE FATHER HOUSEHOLDS
9.7/ 100
METRIC RATING
225th/ 347
METRIC RANK
2.1%
SINGLE FATHER HOUSEHOLDS
99.7/ 100
METRIC RATING
82nd/ 347
METRIC RANK
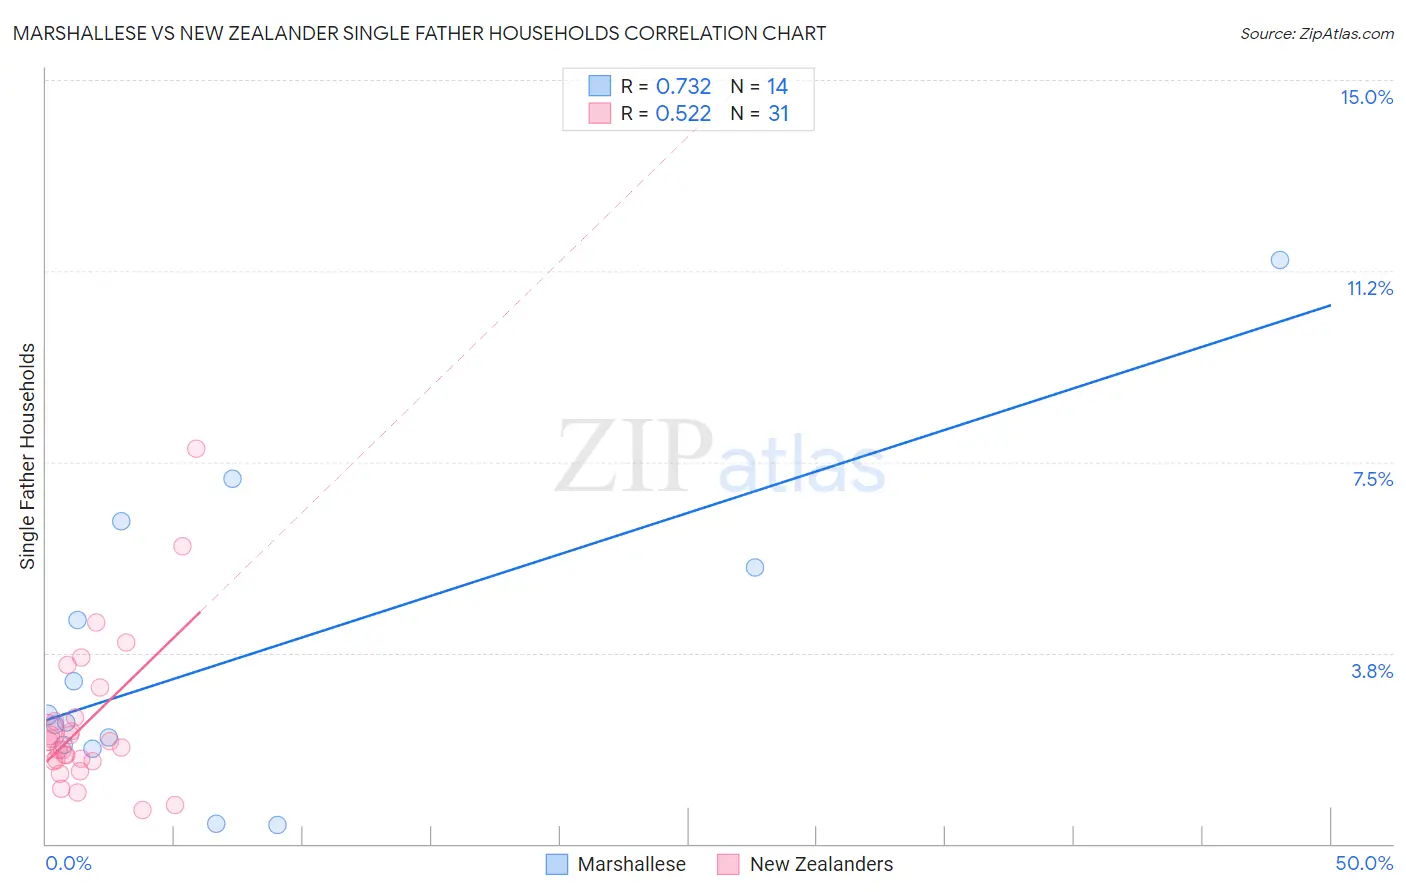
Marshallese vs New Zealander Single Father Households Correlation Chart
The statistical analysis conducted on geographies consisting of 14,759,622 people shows a strong positive correlation between the proportion of Marshallese and percentage of single father households in the United States with a correlation coefficient (R) of 0.732 and weighted average of 2.4%. Similarly, the statistical analysis conducted on geographies consisting of 106,675,257 people shows a substantial positive correlation between the proportion of New Zealanders and percentage of single father households in the United States with a correlation coefficient (R) of 0.522 and weighted average of 2.1%, a difference of 16.4%.
Single Father Households Correlation Summary
| Measurement | Marshallese | New Zealander |
| Minimum | 0.37% | 0.66% |
| Maximum | 11.5% | 7.8% |
| Range | 11.1% | 7.1% |
| Mean | 3.7% | 2.4% |
| Median | 2.5% | 2.0% |
| Interquartile 25% (IQ1) | 1.9% | 1.6% |
| Interquartile 75% (IQ3) | 5.4% | 2.5% |
| Interquartile Range (IQR) | 3.5% | 0.84% |
| Standard Deviation (Sample) | 3.0% | 1.5% |
| Standard Deviation (Population) | 2.9% | 1.5% |
Similar Demographics by Single Father Households
Demographics Similar to Marshallese by Single Father Households
In terms of single father households, the demographic groups most similar to Marshallese are Black/African American (2.4%, a difference of 0.010%), American (2.4%, a difference of 0.080%), Immigrants from Ghana (2.4%, a difference of 0.12%), Immigrants from Bahamas (2.4%, a difference of 0.17%), and Immigrants from Zaire (2.4%, a difference of 0.23%).
| Demographics | Rating | Rank | Single Father Households |
| Immigrants | Ethiopia | 13.4 /100 | #218 | Poor 2.4% |
| Sudanese | 13.0 /100 | #219 | Poor 2.4% |
| Ghanaians | 12.9 /100 | #220 | Poor 2.4% |
| Immigrants | Burma/Myanmar | 12.1 /100 | #221 | Poor 2.4% |
| Immigrants | Eastern Africa | 11.9 /100 | #222 | Poor 2.4% |
| Immigrants | Uruguay | 11.0 /100 | #223 | Poor 2.4% |
| Immigrants | Bahamas | 10.6 /100 | #224 | Poor 2.4% |
| Marshallese | 9.7 /100 | #225 | Tragic 2.4% |
| Blacks/African Americans | 9.7 /100 | #226 | Tragic 2.4% |
| Americans | 9.3 /100 | #227 | Tragic 2.4% |
| Immigrants | Ghana | 9.1 /100 | #228 | Tragic 2.4% |
| Immigrants | Zaire | 8.6 /100 | #229 | Tragic 2.4% |
| Sub-Saharan Africans | 8.3 /100 | #230 | Tragic 2.4% |
| Immigrants | Nonimmigrants | 7.6 /100 | #231 | Tragic 2.4% |
| Pennsylvania Germans | 7.3 /100 | #232 | Tragic 2.4% |
Demographics Similar to New Zealanders by Single Father Households
In terms of single father households, the demographic groups most similar to New Zealanders are Greek (2.1%, a difference of 0.010%), Armenian (2.1%, a difference of 0.050%), Immigrants from South Africa (2.1%, a difference of 0.13%), Immigrants from Asia (2.1%, a difference of 0.22%), and Carpatho Rusyn (2.1%, a difference of 0.31%).
| Demographics | Rating | Rank | Single Father Households |
| Immigrants | Sweden | 99.8 /100 | #75 | Exceptional 2.1% |
| Immigrants | Scotland | 99.8 /100 | #76 | Exceptional 2.1% |
| Immigrants | Saudi Arabia | 99.8 /100 | #77 | Exceptional 2.1% |
| Estonians | 99.7 /100 | #78 | Exceptional 2.1% |
| Immigrants | Asia | 99.7 /100 | #79 | Exceptional 2.1% |
| Immigrants | South Africa | 99.7 /100 | #80 | Exceptional 2.1% |
| Armenians | 99.7 /100 | #81 | Exceptional 2.1% |
| New Zealanders | 99.7 /100 | #82 | Exceptional 2.1% |
| Greeks | 99.7 /100 | #83 | Exceptional 2.1% |
| Carpatho Rusyns | 99.6 /100 | #84 | Exceptional 2.1% |
| Immigrants | Hungary | 99.6 /100 | #85 | Exceptional 2.1% |
| Asians | 99.6 /100 | #86 | Exceptional 2.1% |
| Lithuanians | 99.5 /100 | #87 | Exceptional 2.1% |
| Bhutanese | 99.5 /100 | #88 | Exceptional 2.1% |
| Immigrants | Armenia | 99.5 /100 | #89 | Exceptional 2.1% |